Schneider Electric SE (Societas Europaea) is a multinational company providing energy and automation digital solutions for efficiency and sustainability. It addresses homes, buildings,data centers,infrastructure and industries, by combining energy technologies, real-time automation, software and services. The company has operations in over 100 countries and employs 135,000+ people. Schneider Electric is a Fortune Global 500 company, publicly traded on the Euronext Exchange, and is a component of the Euro Stoxx 50 stock market index. In FY2019, the company posted revenues of €27.2 billion. Schneider Electric is the parent company of Square D, APC and others. It is also a research company, investing EUR10 billion in innovation and R&D for sustainable development between 2015 and 2025. The company holds 20,000 patents either active or in application worldwide and invests 5% of its annual revenue in Research and Development.The company began in 1836 as Schneider & Cie. It was ultimately renamed Schneider Electric in May 1999. In 2021, Schneider Electric was ranked most sustainable company in the world out of 8,000 companies assessed by Corporate Knights.(https://en.wikipedia.org/wiki/Schneider_Electric)
How does Schneider Electric develop in the past 12 months?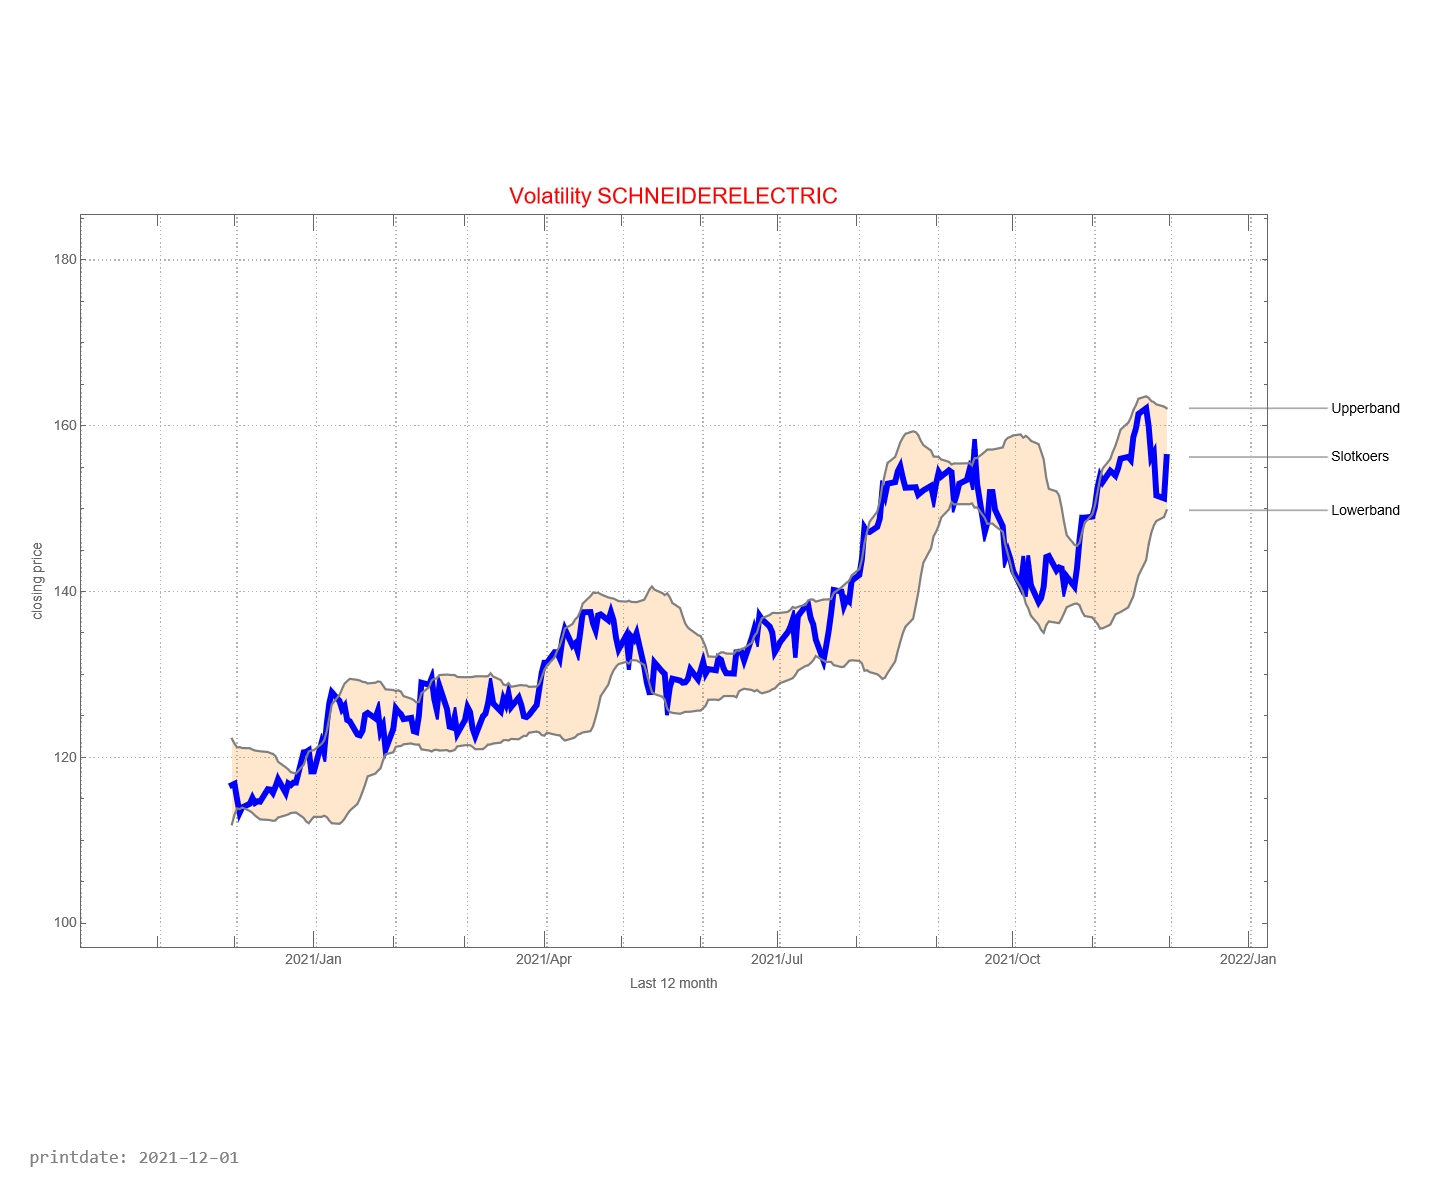
The graph below shows the history of issued buy and sell signals. The light blue part of the graph below shows the signals for the coming month. A red stop is “buy” and a blue dot is “sell”. The red line between buying and selling provides information about how long the Schneider Electric fund has been in the portfolio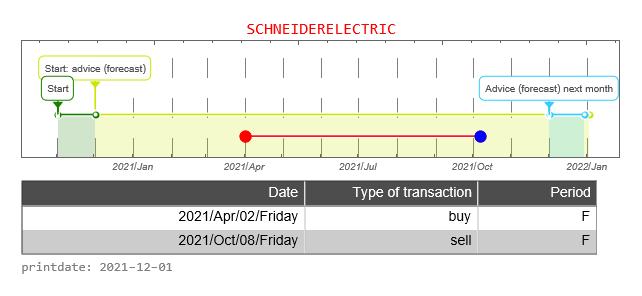
The graph below shows the buy and sell signals given in relation to the price development. In the table below you can see the date that a signal was issued, the type of signal (buy versus sell), whether the signal was issued in the forecast period, and the closing price of the stock on that day. The graph below, therefore, resembles the graph above to a certain extent, only without the forecast.![]()
![]()
The CAC40 is a weighted average of the most important 40 companies whose shares can be traded on the Paris Stock Exchange. It is now interesting to see how Schneider Electric share compares with the CAC40. In the graph above, we do this by starting both prices at the same level. That is, the price is indexed to “1”.
How well is the Trading Robot doing? For this, we make a simulation of 12 months each time. We calculate the return the trading robot would have made if you had followed signals for this fund. And we compare the result with if you would do nothing. That is, on day one you buy the fund and 365 days you sell the stock.
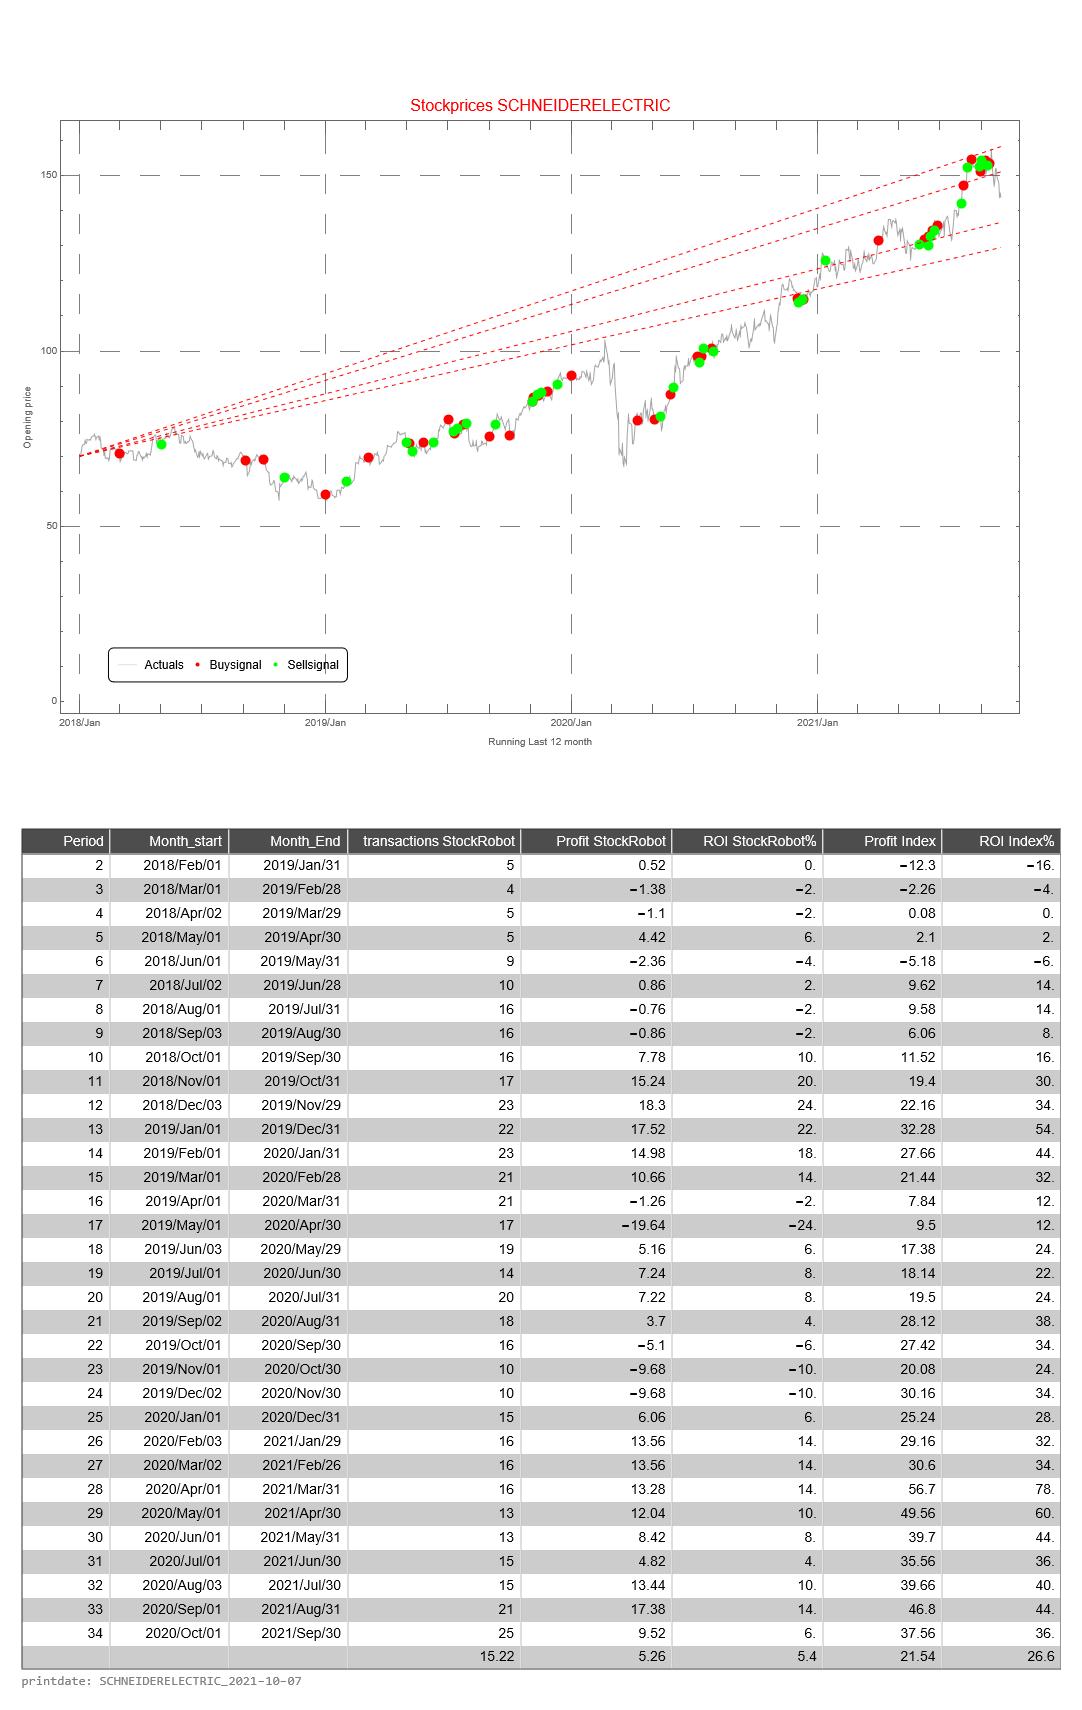
This simulation is repeated 31 times. The difference is that with each subsequent simulation the period shifts by one month. When shifting the 12 months, the simulation only looks at the buy and sell signals from that particular period.
The return of the Trading Robot is calculated as follows.
- the difference between the price of the fund between selling and buying (of 1 share of the relevant fund)
- we calculate the cumulative difference for multiple buy and sell signals
- if there has been no sell signal at the end of the 12-month period, we use the price on the last day of the 12-month period
- we calculate the average price value of a buy signal
- the cumulative difference divided by the average price is the return over the 12 months
The Profit HR (Trading Robot Profit) is the cumulative difference between buy and sell signals of 1 share of the relevant fund
The return of the Trading Robot is the Profit over the last 12 month divided by the price value of the first day of a 12-month period of the relevant fund