Sanofi S.A. is a French multinational pharmaceutical company headquartered in Paris, France, as of 2013 the world’s fifth-largest by prescription sales. Originally, the company was established in 1973 and merged with Synthélabo in 1999 to form Sanofi-Synthélabo. In 2004, Sanofi-Synthélabo merged with Aventis and renamed to Sanofi-Aventis, which were each the product of several previous mergers. It changed its name back to Sanofi in May 2011. The company is a component of the Euro Stoxx 50 stock market index. Sanofi engages in the research and development, manufacturing and marketing of pharmaceutical drugs principally in the prescription market, but the firm also develops over-the-counter medication. The company covers seven major therapeutic areas: cardiovascular, central nervous system, diabetes, internal medicine, oncology, thrombosis and vaccines (it is the world’s largest producer of the latter through its subsidiary Sanofi Pasteur). In 2017, Sanofi’s dengue vaccine Dengvaxia garnered controversy because it caused some vaccinated young children to have more cases of severe dengue. The New York Times cited criticism for Sanofi’s aggressive ad campaign despite the fact that this new vaccine was not completely safe.(https://en.wikipedia.org/wiki/Sanofi)
How does Sanofi develop in the past 12 months?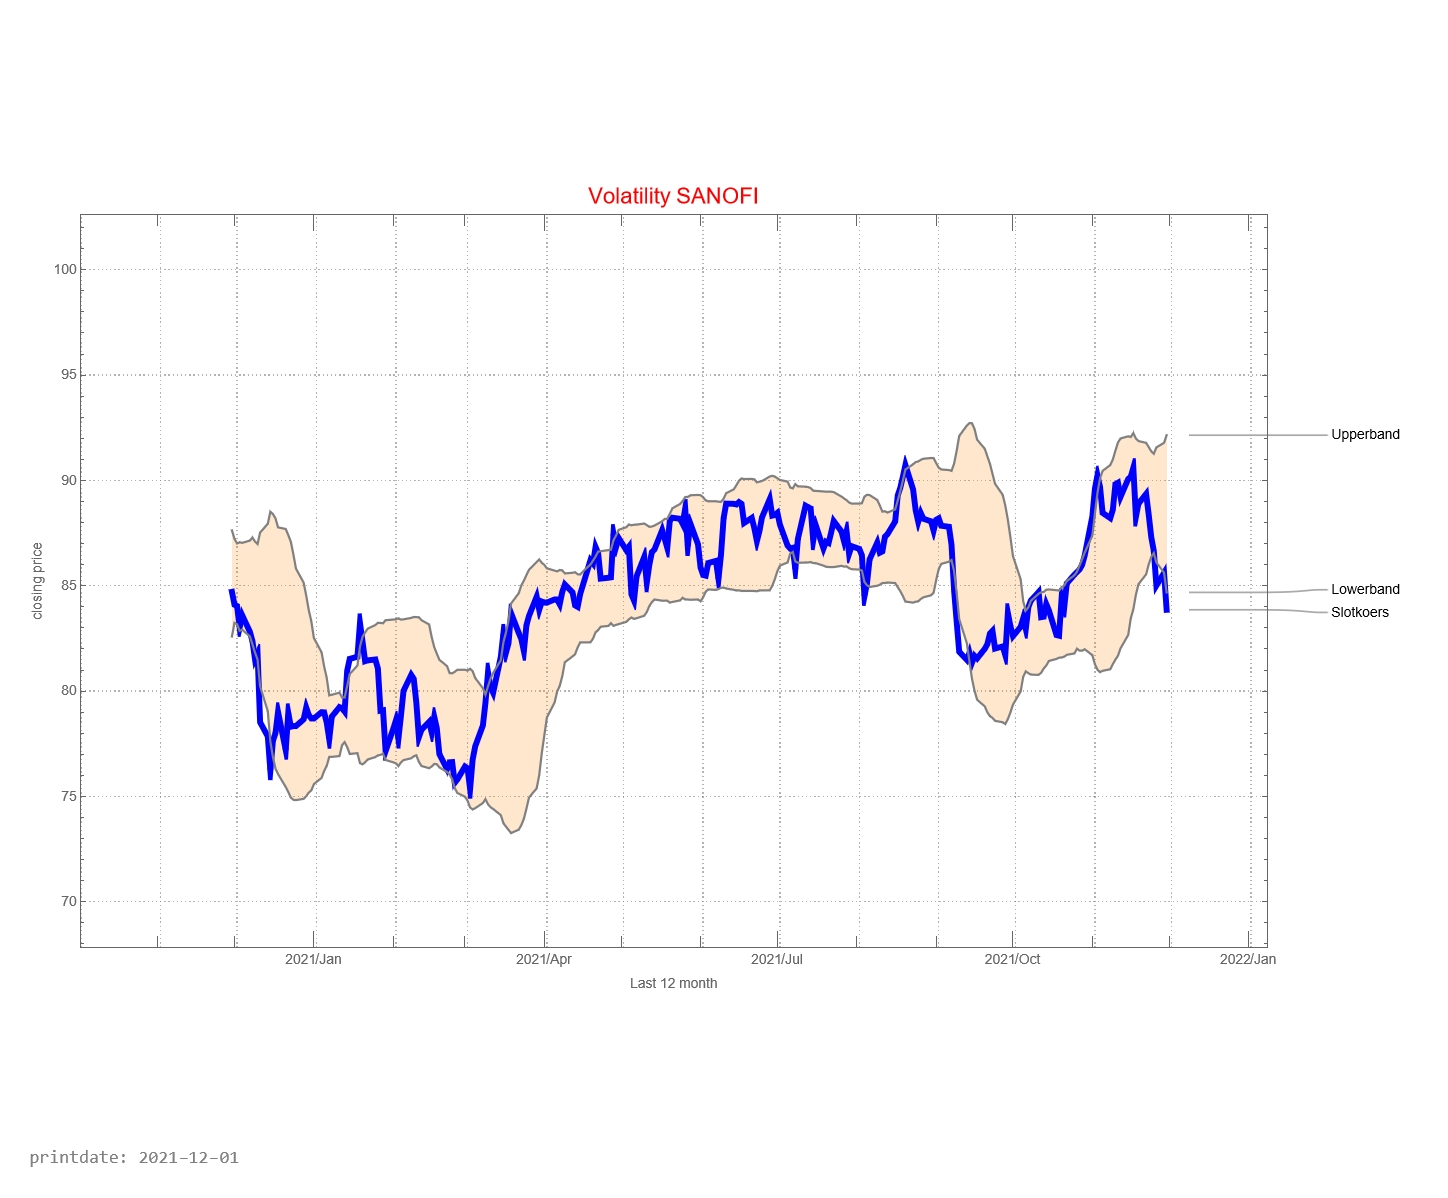
The graph below shows the history of issued buy and sell signals. The light blue part of the graph below shows the signals for the coming month. A red stop is “buy” and a blue dot is “sell”. The red line between buying and selling provides information about how long the Sanofi fund has been in the portfolio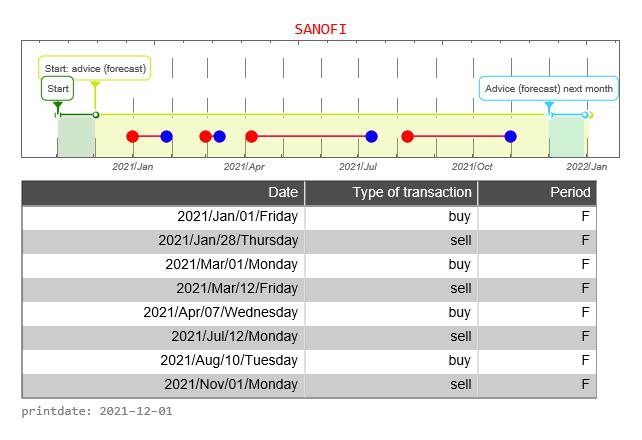
The graph below shows the buy and sell signals given in relation to the price development. In the table below you can see the date that a signal was issued, the type of signal (buy versus sell), whether the signal was issued in the forecast period, and the closing price of the stock on that day. The graph below, therefore, resembles the graph above to a certain extent, only without the forecast.![]()
![]()
The CAC40 is a weighted average of the most important 40 companies whose shares can be traded on the Paris Stock Exchange. It is now interesting to see how Sanofi share compares with the CAC40. In the graph above, we do this by starting both prices at the same level. That is, the price is indexed to “1”.
How well is the Trading Robot doing? For this, we make a simulation of 12 months each time. We calculate the return the trading robot would have made if you had followed signals for this fund. And we compare the result with if you would do nothing. That is, on day one you buy the fund and 365 days you sell the stock.
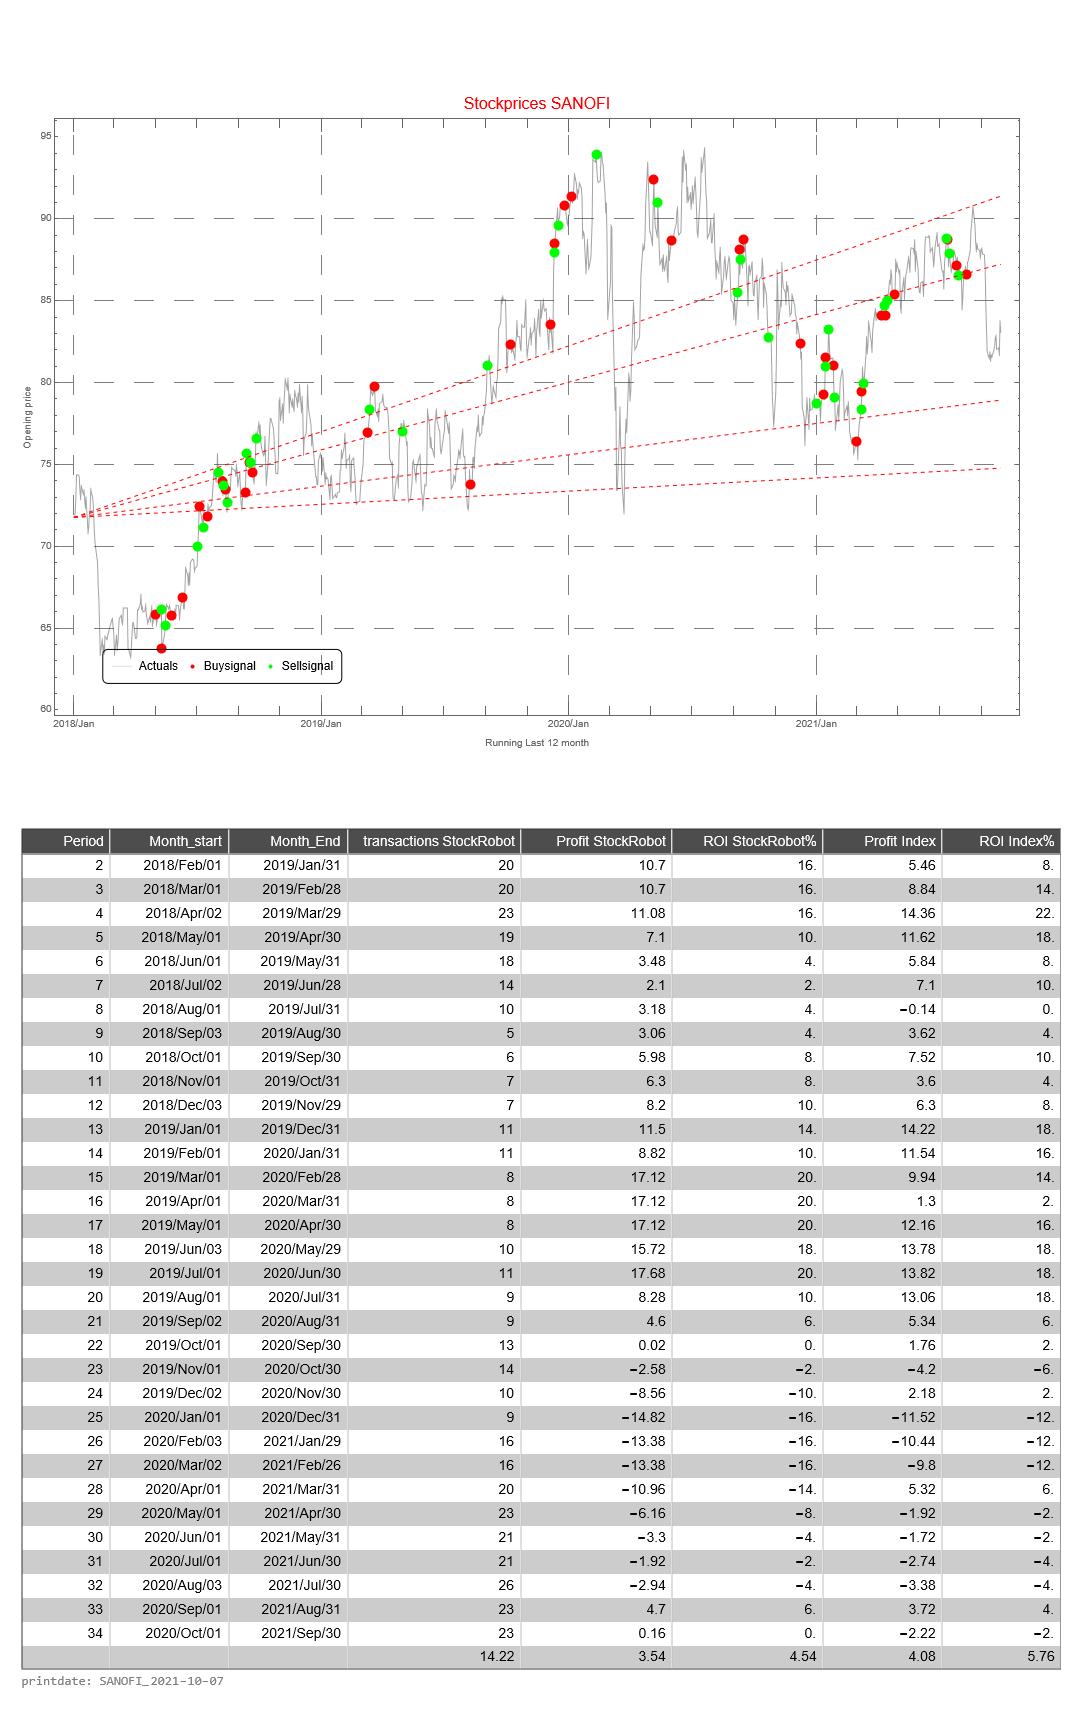
This simulation is repeated 31 times. The difference is that with each subsequent simulation the period shifts by one month. When shifting the 12 months, the simulation only looks at the buy and sell signals from that particular period.
The return of the Trading Robot is calculated as follows.
- the difference between the price of the fund between selling and buying (of 1 share of the relevant fund)
- we calculate the cumulative difference for multiple buy and sell signals
- if there has been no sell signal at the end of the 12-month period, we use the price on the last day of the 12-month period
- we calculate the average price value of a buy signal
- the cumulative difference divided by the average price is the return over the 12 months
The Profit HR (Trading Robot Profit) is the cumulative difference between buy and sell signals of 1 share of the relevant fund
The return of the Trading Robot is the Profit over the last 12 month divided by the price value of the first day of a 12-month period of the relevant fund