Orange S.A.,formerly France Télécom S.A., stylized as france telecom, is a French multinational telecommunications corporation. It has 266 million customers worldwide and employs 89,000 people in France, and 59,000 elsewhere. It is the 11th largest mobile network operator in the world and the 3rd largest in Europe after Vodafone, Telefónica . In 2015, the group had revenue of €40 billion. The company’s head office is located in the 15th arrondissement of Paris. The current CEO is Stéphane Richard. Orange has been the company’s main brand for mobile, landline, internet and Internet Protocol television (IPTV) services since 2006. It originated in 1994 when Hutchison Whampoa acquired a controlling stake in Microtel Communications during the early 1990s and rebranded it as “Orange”. It became a subsidiary of Mannesmann in 1999 and was acquired by France Télécom in 2000. The company was rebranded as Orange on 1 July 2013. (https://en.wikipedia.org/wiki/Orange_S.A.)
How does Orange develop in the past 12 months?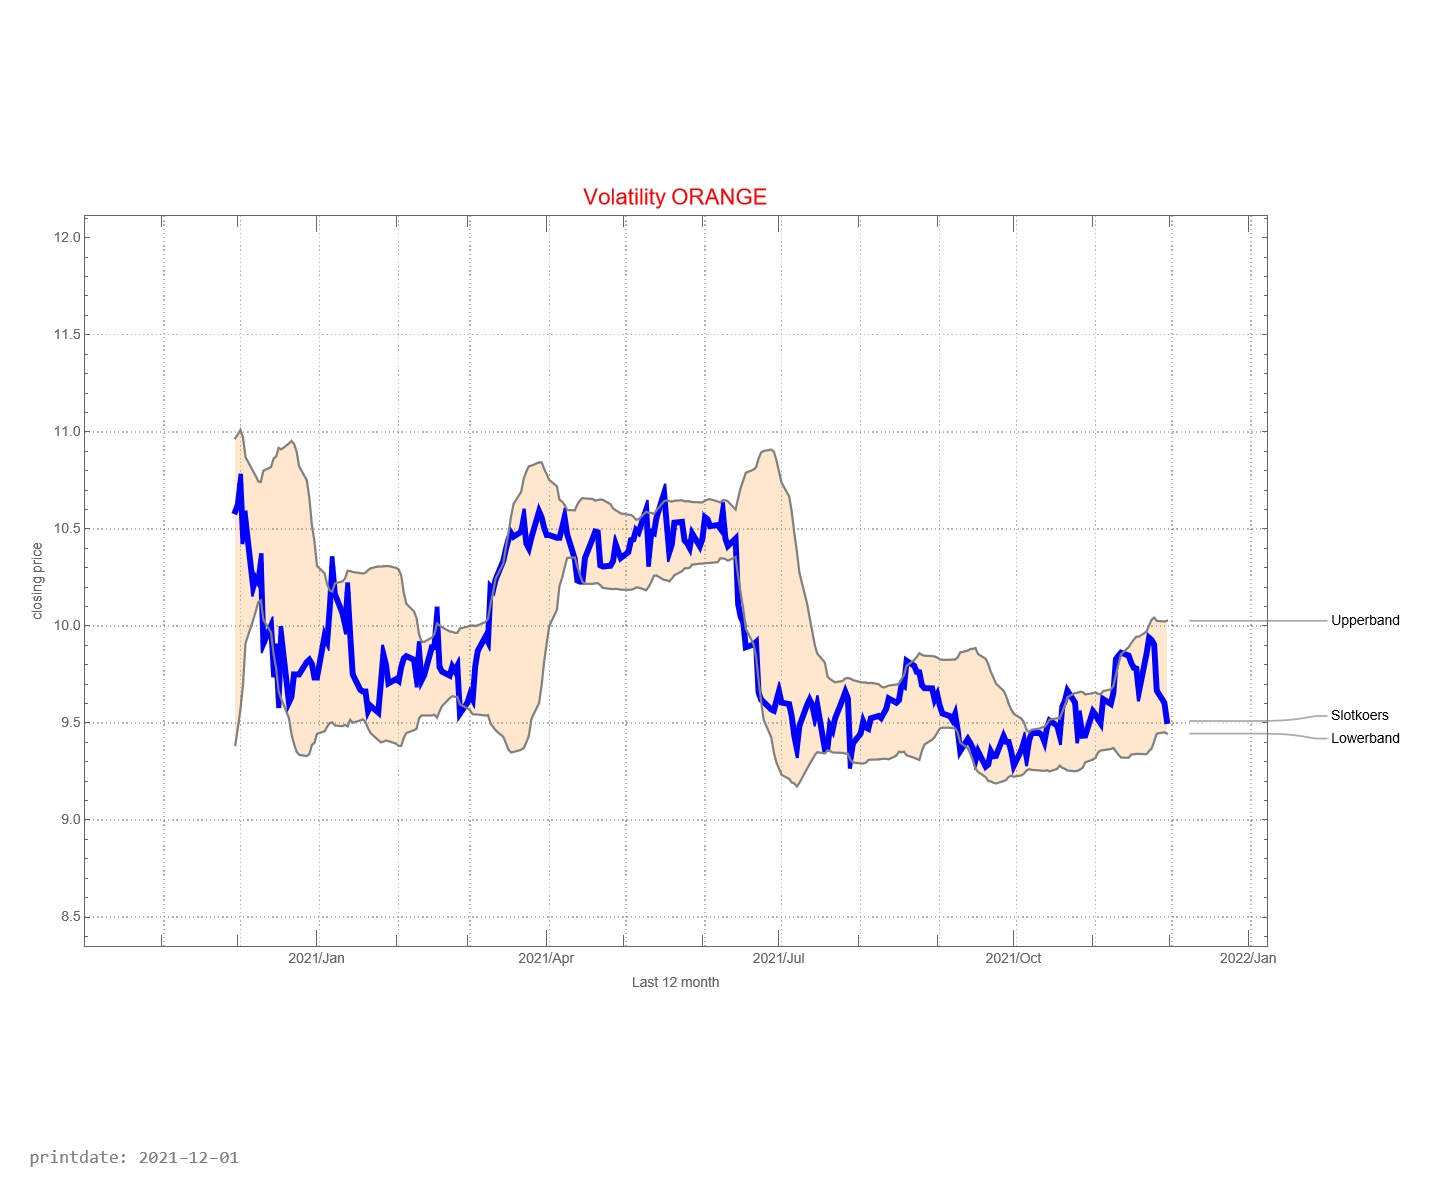
The graph below shows the history of issued buy and sell signals. The light blue part of the graph below shows the signals for the coming month. A red stop is “buy” and a blue dot is “sell”. The red line between buying and selling provides information about how long the Orange fund has been in the portfolio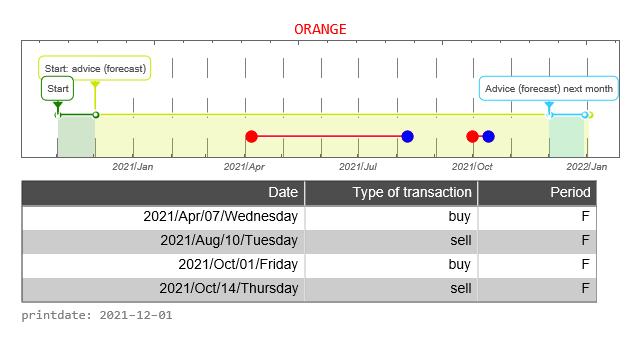
The graph below shows the buy and sell signals given in relation to the price development. In the table below you can see the date that a signal was issued, the type of signal (buy versus sell), whether the signal was issued in the forecast period, and the closing price of the stock on that day. The graph below, therefore, resembles the graph above to a certain extent, only without the forecast.![]()
![]()
The CAC40 is a weighted average of the most important 40 companies whose shares can be traded on the Paris Stock Exchange. It is now interesting to see how Orange share compares with the CAC40. In the graph above, we do this by starting both prices at the same level. That is, the price is indexed to “1”.
How well is the Trading Robot doing? For this, we make a simulation of 12 months each time. We calculate the return the trading robot would have made if you had followed signals for this fund. And we compare the result with if you would do nothing. That is, on day one you buy the fund and 365 days you sell the stock.
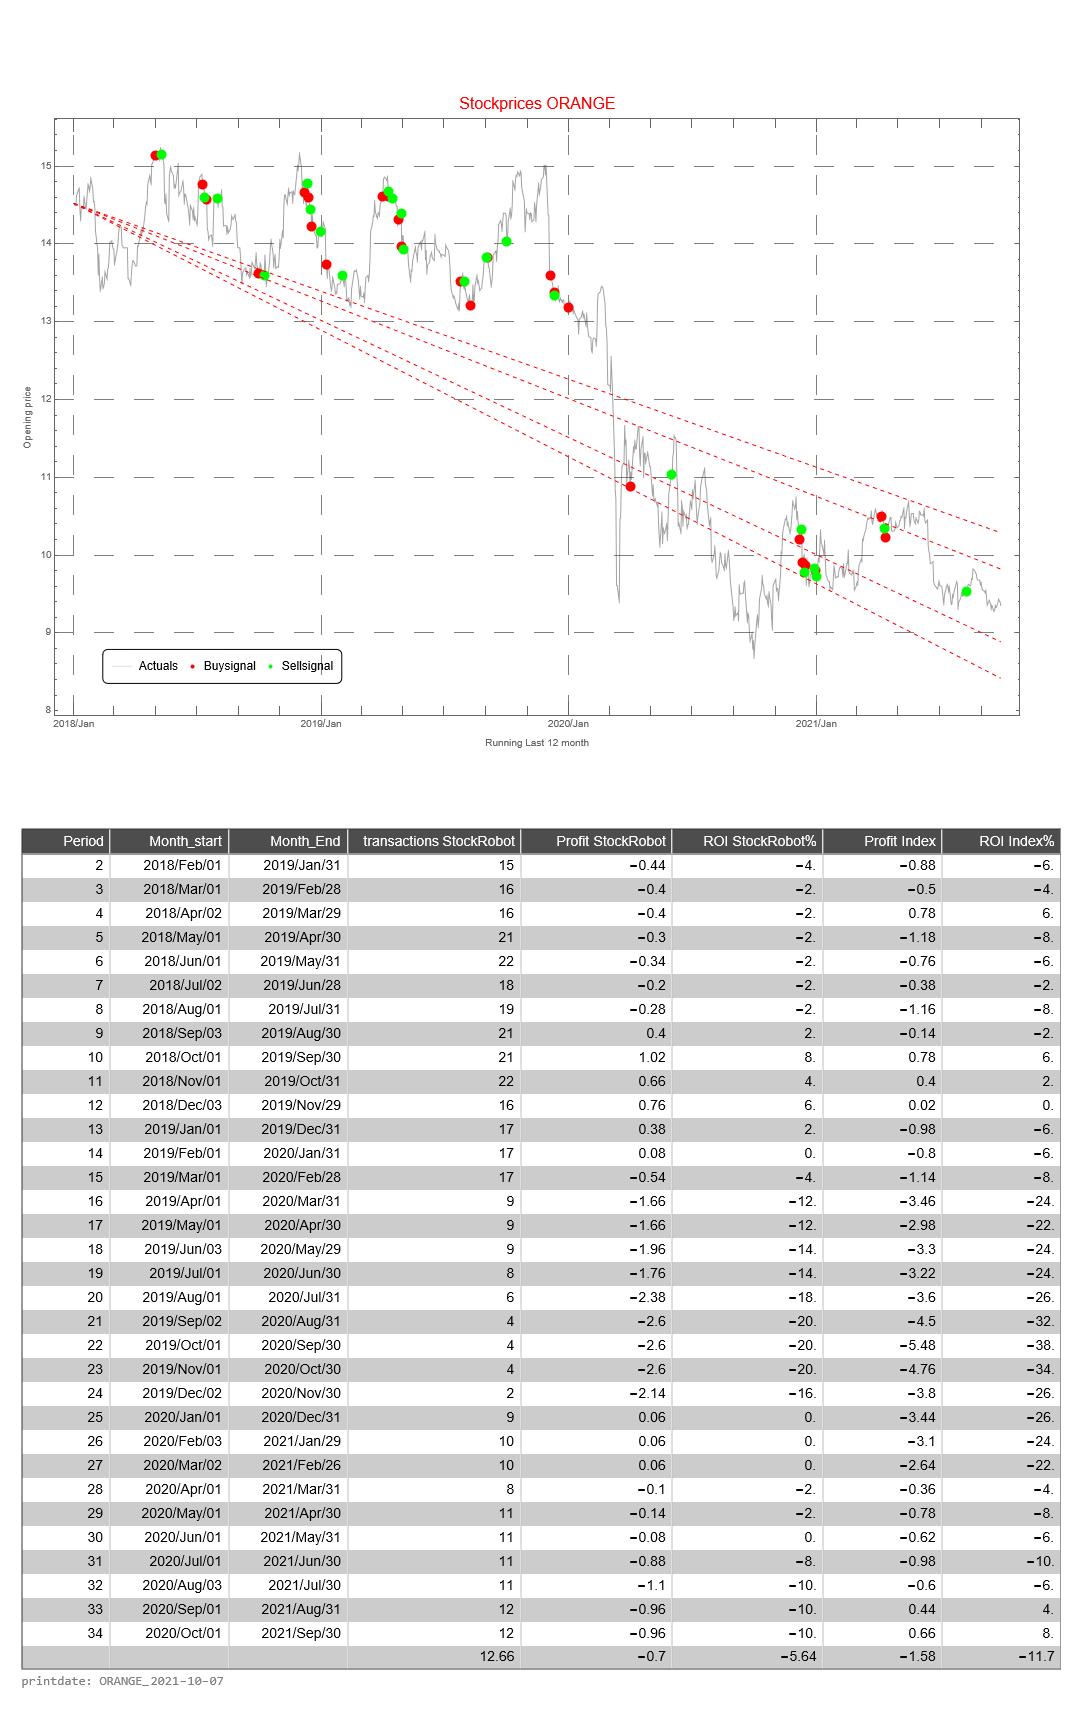
This simulation is repeated 31 times. The difference is that with each subsequent simulation the period shifts by one month. When shifting the 12 months, the simulation only looks at the buy and sell signals from that particular period.
The return of the Trading Robot is calculated as follows.
- the difference between the price of the fund between selling and buying (of 1 share of the relevant fund)
- we calculate the cumulative difference for multiple buy and sell signals
- if there has been no sell signal at the end of the 12-month period, we use the price on the last day of the 12-month period
- we calculate the average price value of a buy signal
- the cumulative difference divided by the average price is the return over the 12 months
The Profit HR (Trading Robot Profit) is the cumulative difference between buy and sell signals of 1 share of the relevant fund
The return of the Trading Robot is the Profit over the last 12 month divided by the price value of the first day of a 12-month period of the relevant fund