LVMH Moët Hennessy Louis Vuitton commonly known as LVMH, is a French Holding multinational corporation and conglomerate specializing in luxury goods, headquartered in Paris, France. The company was formed in 1987 through the merger of fashion house Louis Vuitton (founded in 1854) with Moët Hennessy, which was established after the 1971 merger between the champagne producer Moët & Chandon (founded in 1743) and the cognac producer Hennessy (founded in 1765).In 2021 with a valuation of €329 billion, LVMH became the most valuable company in Europe. LVMH controls around 60 subsidiaries that each manage a small number of prestigious brands, 75 in total. These include Christian Dior, Givenchy, Marc Jacobs, Stella McCartney, Loro Piana, Kenzo, Celine, Fenty, Princess Yachts, and Bulgari. The subsidiaries are often managed independently, under the umbrellas of six branches: Fashion Group, Wines and Spirits, Perfumes and Cosmetics, Watches and Jewelry, Selective Distribution, and Other Activities. The oldest of the LVMH brands is wine producer Château d’Yquem, which dates its origins back to 1593. (https://en.wikipedia.org/wiki/LVMH)
How does VMH Moët Hennessy Louis Vuitton develop in the past 12 months?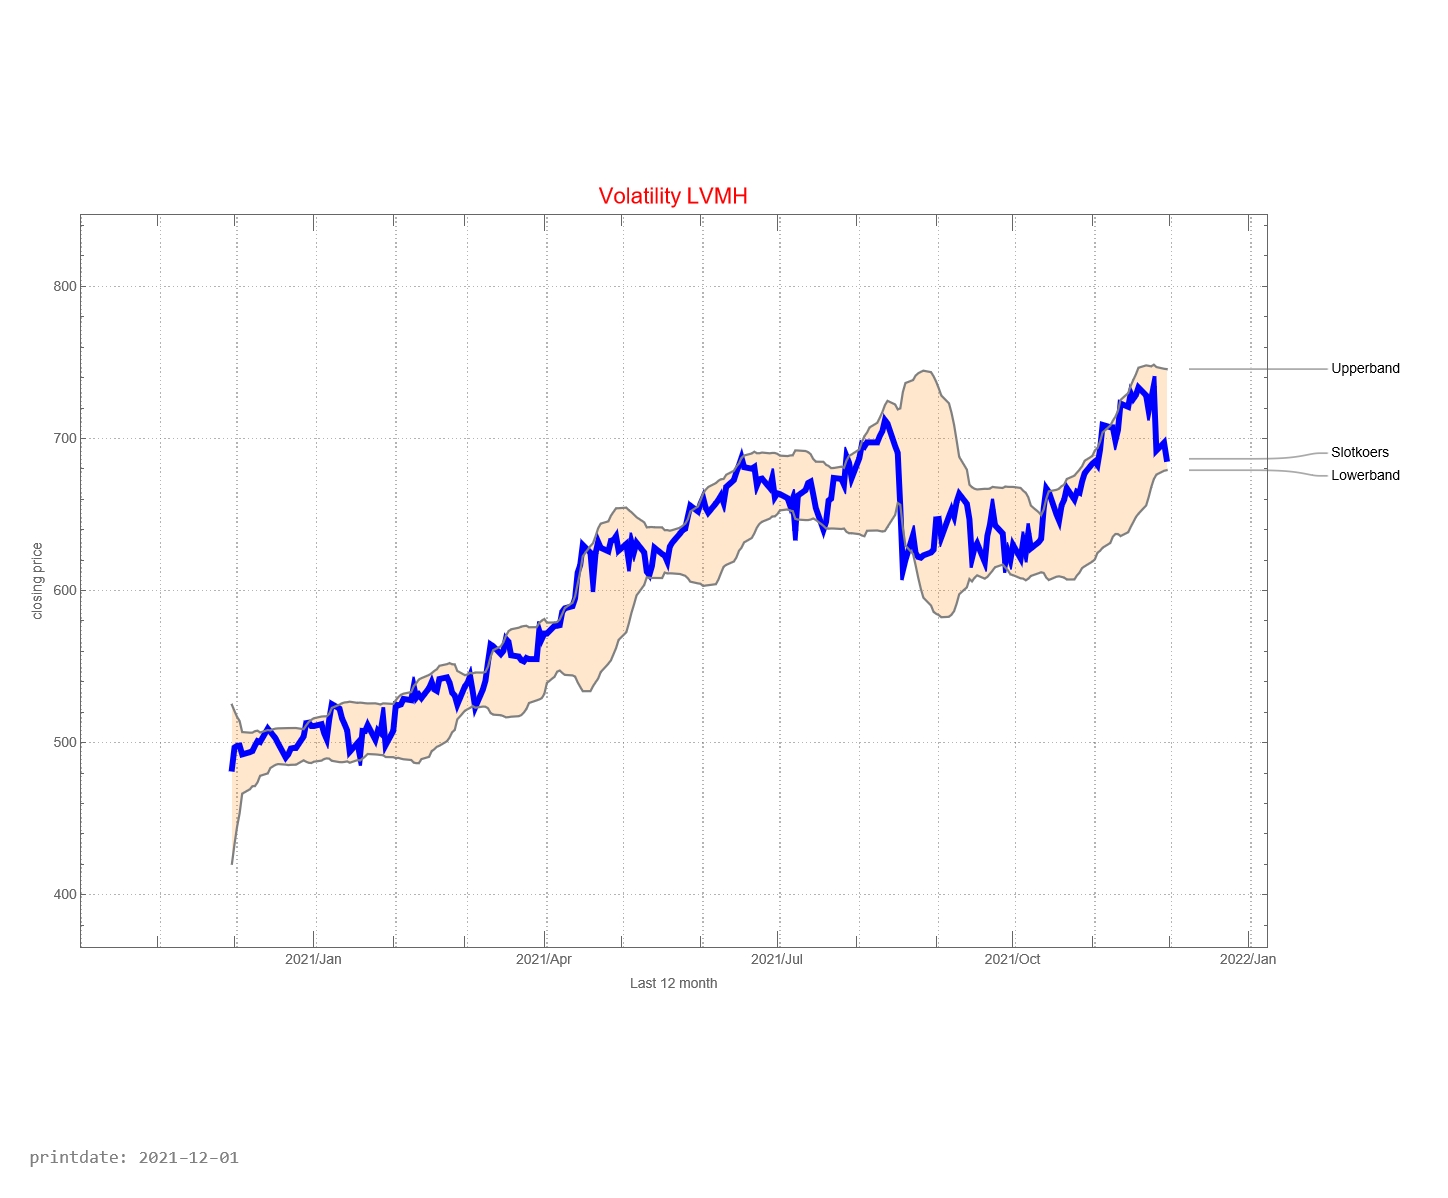
The graph below shows the history of issued buy and sell signals. The light blue part of the graph below shows the signals for the coming month. A red stop is “buy” and a blue dot is “sell”. The red line between buying and selling provides information about how long the VMH Moët Hennessy Louis Vuitton fund has been in the portfolio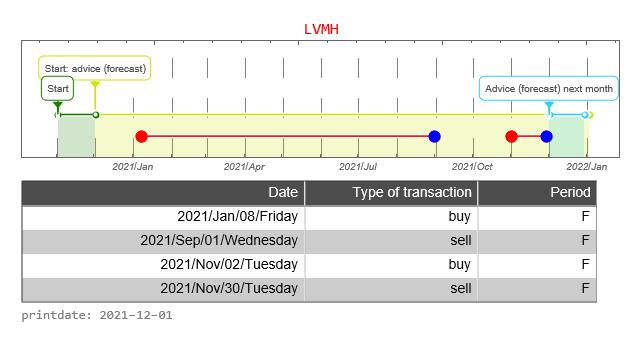
The graph below shows the buy and sell signals given in relation to the price development. In the table below you can see the date that a signal was issued, the type of signal (buy versus sell), whether the signal was issued in the forecast period, and the closing price of the stock on that day. The graph below, therefore, resembles the graph above to a certain extent, only without the forecast.![]()
![]()
The CAC40 is a weighted average of the most important 40 companies whose shares can be traded on the Paris Stock Exchange. It is now interesting to see how VMH Moët Hennessy Louis Vuitton share compares with the CAC40. In the graph above, we do this by starting both prices at the same level. That is, the price is indexed to “1”.
How well is the Trading Robot doing? For this, we make a simulation of 12 months each time. We calculate the return the trading robot would have made if you had followed signals for this fund. And we compare the result with if you would do nothing. That is, on day one you buy the fund and 365 days you sell the stock.
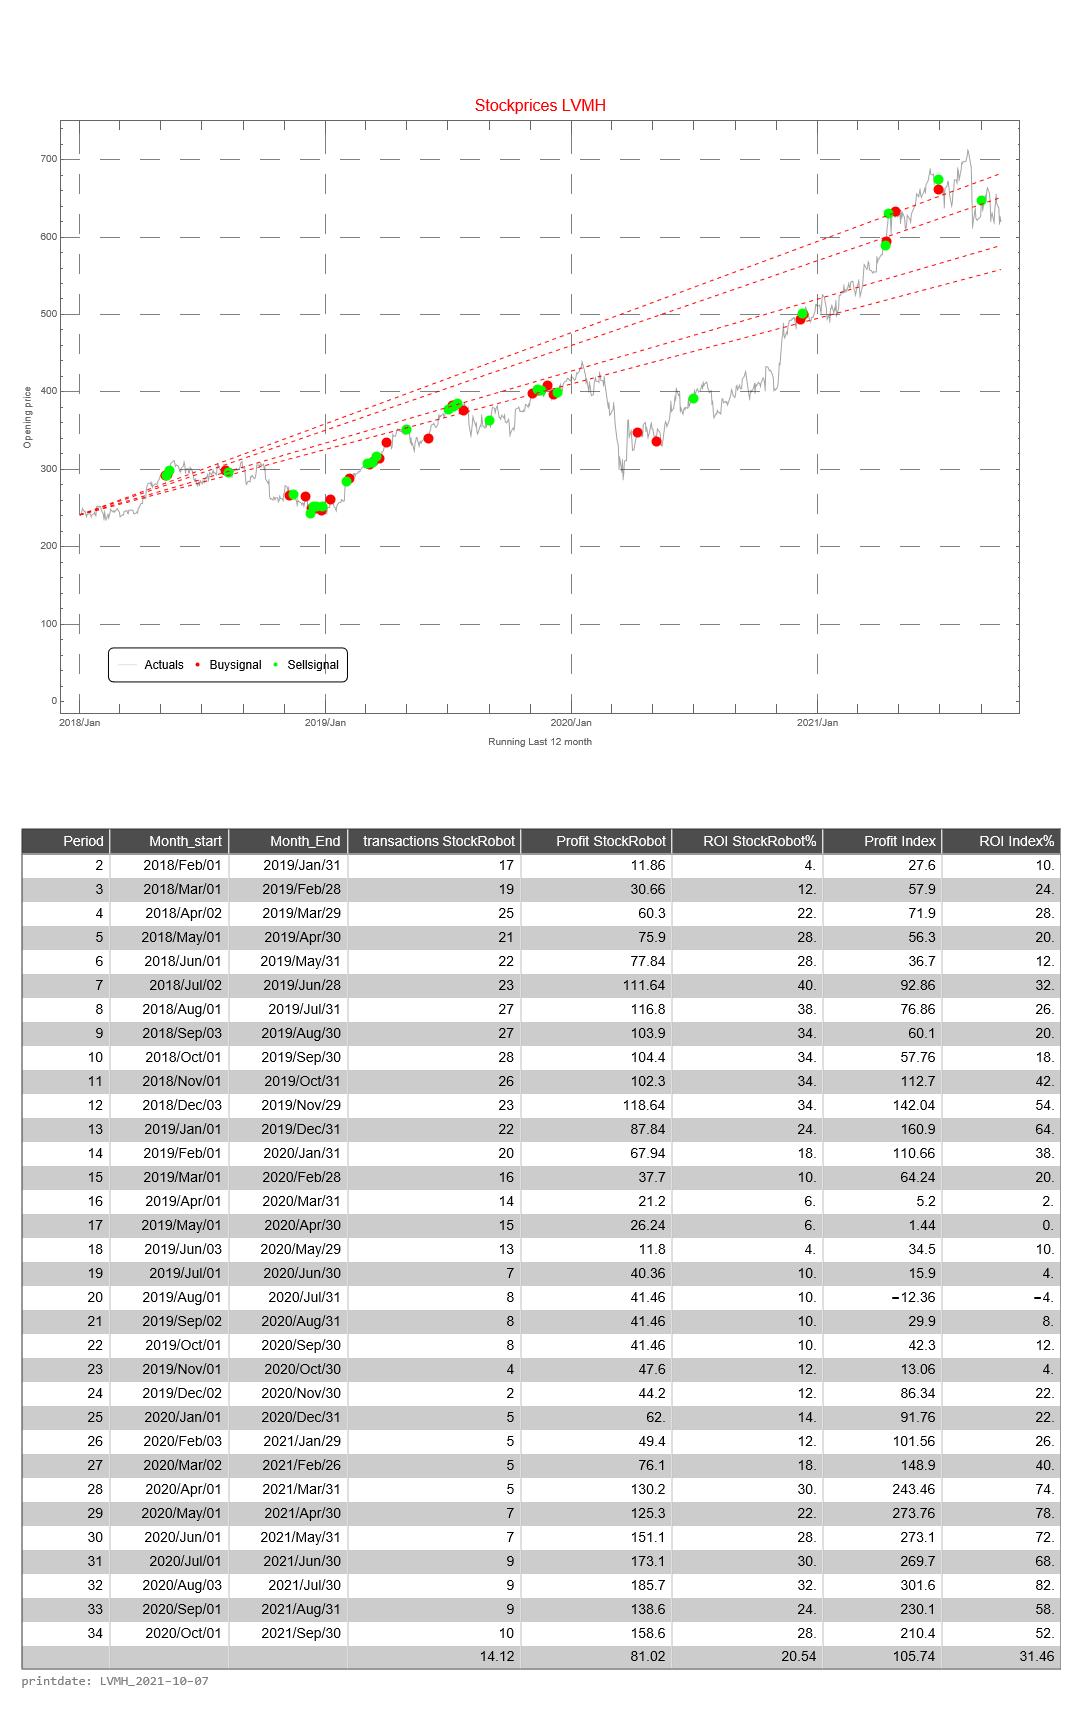
This simulation is repeated 31 times. The difference is that with each subsequent simulation the period shifts by one month. When shifting the 12 months, the simulation only looks at the buy and sell signals from that particular period.
The return of the Trading Robot is calculated as follows.
- the difference between the price of the fund between selling and buying (of 1 share of the relevant fund)
- we calculate the cumulative difference for multiple buy and sell signals
- if there has been no sell signal at the end of the 12-month period, we use the price on the last day of the 12-month period
- we calculate the average price value of a buy signal
- the cumulative difference divided by the average price is the return over the 12 months
The Profit HR (Trading Robot Profit) is the cumulative difference between buy and sell signals of 1 share of the relevant fund
The return of the Trading Robot is the Profit over the last 12 month divided by the price value of the first day of a 12-month period of the relevant fund