BNP Paribas S.A. is a French international banking group. It is the largest French banking group, the largest bank in Europe, and world’s seventh largest bank by total assets.It was formed through the merger of Banque Nationale de Paris (BNP) and Paribas in 2000, although its corporate identity descends from its foundation in 1848 as a French national bank. It is one of three major international French banks, along with Société Générale and Crédit Agricole.The group is listed on the first market of Euronext Paris and a component of the Euro Stoxx 50 stock market index, while it also included in the French CAC 40 index. BNP Paribas operates in 72 countries across five continents.It includes a retail banking section and investment banking operations, with its retail banking networks serving more than 30 million customers in three domestic markets, France, Belgium and Italy, through several brands such as BNL and Fortis. The retail component operates in the Mediterranean region and in Africa. In the Americas, it operates in the western United States as Bank of the West. As an investment bank and international financial services provider for corporate and institutional clients, it is present across Europe, the Americas, and Asia. BNP Paribas is the largest French banking group and the largest bank in the Eurozone. It became one of the five largest banks in the world following the 2008 financial crisis.Despite some legal difficulties in 2014, including being fined the largest ever sum as reparation for violating U.S. sanctions, it remains one of the ten largest banks worldwide.It is considered a systemically important bank by the Financial Stability Board. (https://en.wikipedia.org/wiki/BNP_Paribas)
How does BNP Paribas develop in the past 12 months?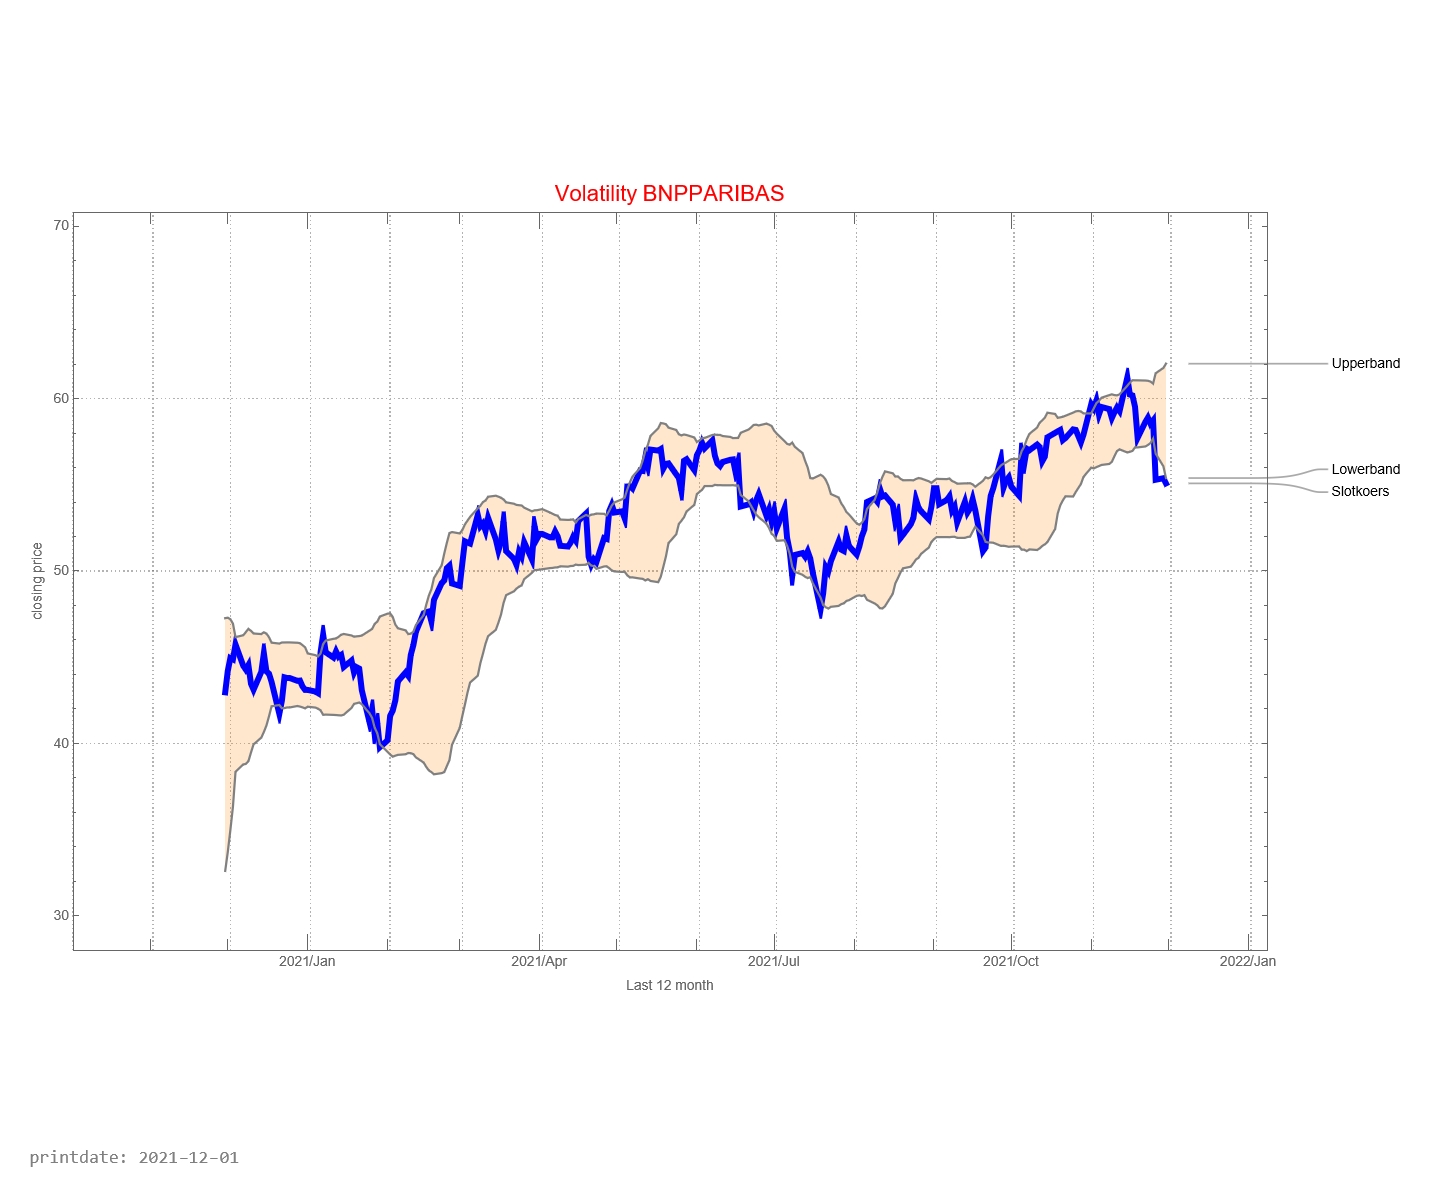
The graph below shows the history of issued buy and sell signals. The light blue part of the graph below shows the signals for the coming month. A red stop is “buy” and a blue dot is “sell”. The red line between buying and selling provides information about how long the BNP Paribas fund has been in the portfolio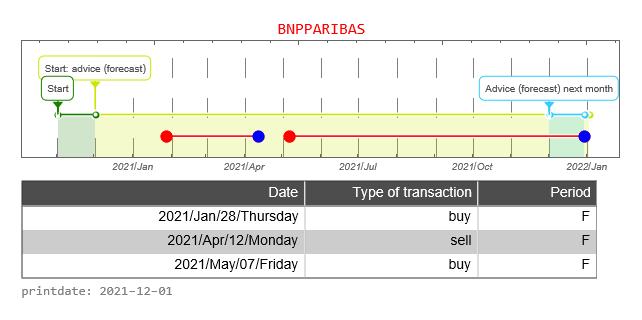
The graph below shows the buy and sell signals given in relation to the price development. In the table below you can see the date that a signal was issued, the type of signal (buy versus sell), whether the signal was issued in the forecast period, and the closing price of the stock on that day. The graph below, therefore, resembles the graph above to a certain extent, only without the forecast.![]()
![]()
The CAC40 is a weighted average of the most important 40 companies whose shares can be traded on the Paris Stock Exchange. It is now interesting to see how BNP Paribas share compares with the CAC40. In the graph above, we do this by starting both prices at the same level. That is, the price is indexed to “1”.
How well is the Trading Robot doing? For this, we make a simulation of 12 months each time. We calculate the return the trading robot would have made if you had followed signals for this fund. And we compare the result with if you would do nothing. That is, on day one you buy the fund and 365 days you sell the stock.
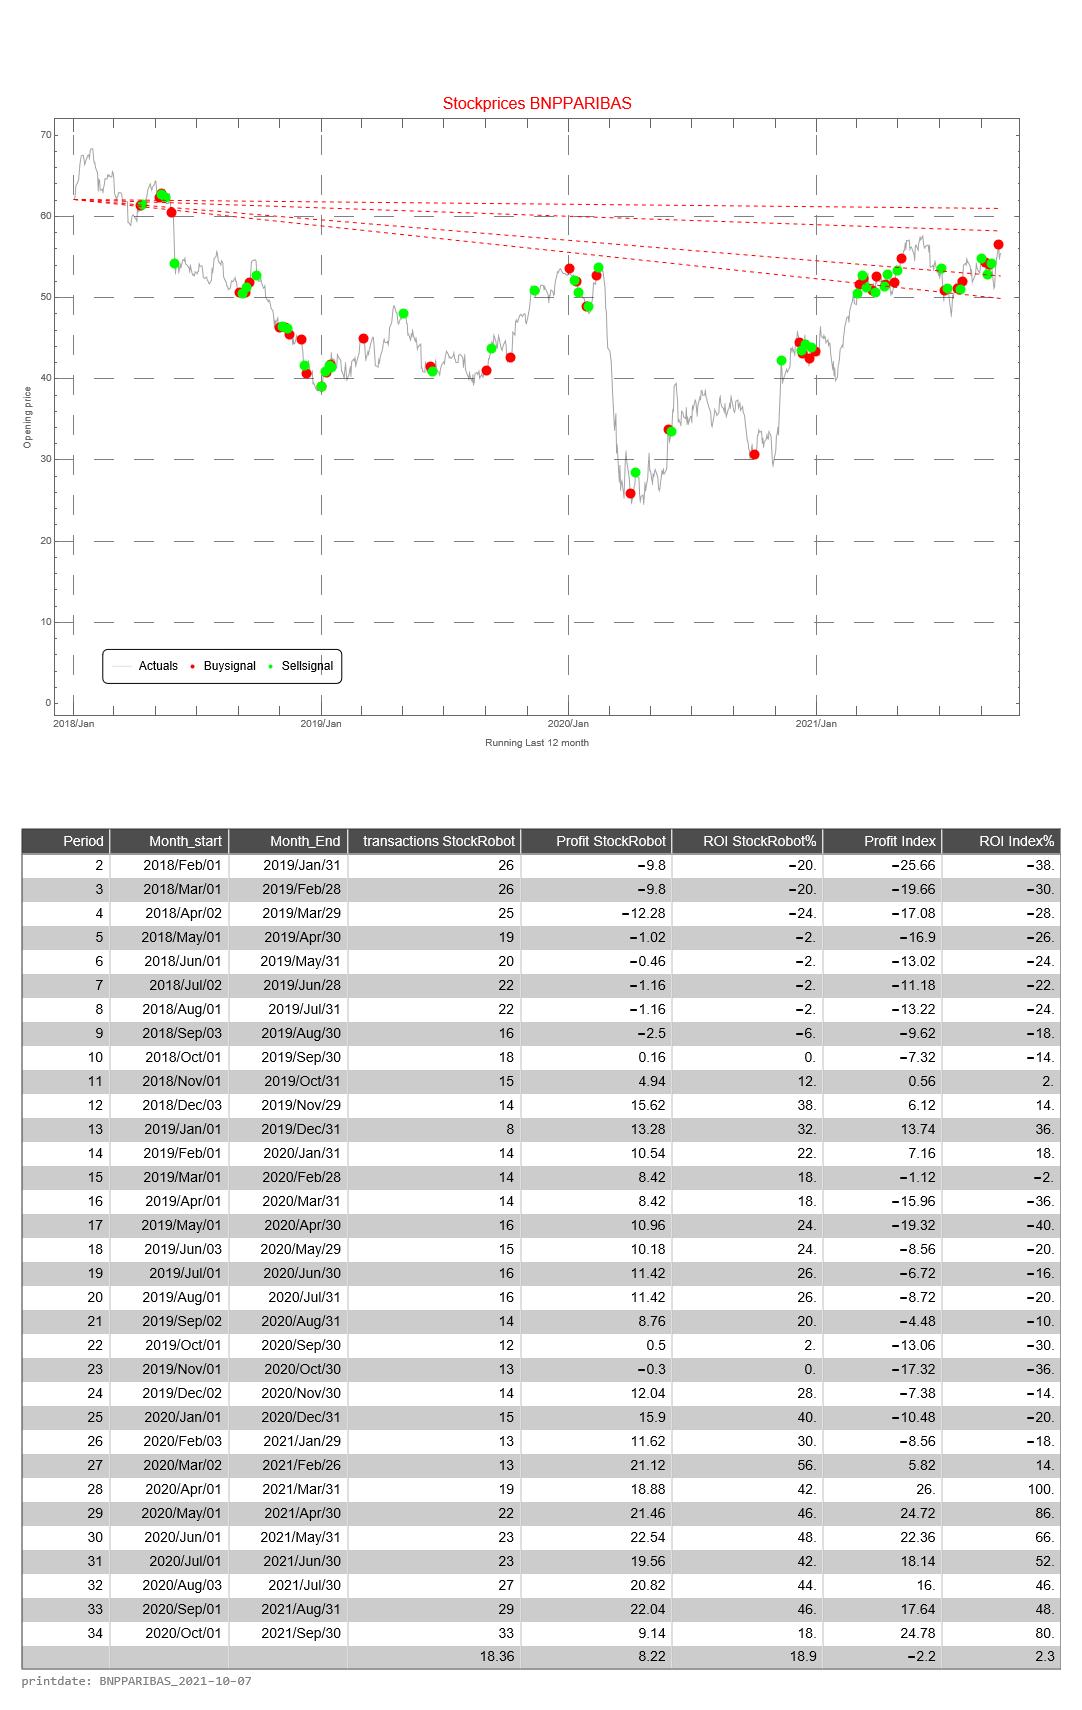
This simulation is repeated 31 times. The difference is that with each subsequent simulation the period shifts by one month. When shifting the 12 months, the simulation only looks at the buy and sell signals from that particular period.
The return of the Trading Robot is calculated as follows.
- the difference between the price of the fund between selling and buying (of 1 share of the relevant fund)
- we calculate the cumulative difference for multiple buy and sell signals
- if there has been no sell signal at the end of the 12-month period, we use the price on the last day of the 12-month period
- we calculate the average price value of a buy signal
- the cumulative difference divided by the average price is the return over the 12 months
The Profit HR (Trading Robot Profit) is the cumulative difference between buy and sell signals of 1 share of the relevant fund
The return of the Trading Robot is the Profit over the last 12 month divided by the price value of the first day of a 12-month period of the relevant fund