Airbus SE is a European multinational aerospace corporation. As of 2019, Airbus is the world’s largest airliner manufacturer and took the most airliner orders, surpassing rival Boeing.It designs, manufactures and sells civil and military aerospace products worldwide and manufactures aircraft in the European Union and various other countries. The company has three divisions: Commercial Aircraft (Airbus S.A.S.), Defence and Space, and Helicopters, the third being the largest in its industry in terms of revenues and turbine helicopter deliveries. The company’s main civil aeroplane business is conducted through the French company Airbus S.A.S., based in Blagnac, a suburb of Toulouse, with production and manufacturing facilities mostly in Europe (France, Germany, Spain, United Kingdom) but also in China, the United States and Canada. Final assembly production is based in Toulouse, France; Hamburg, Germany; Seville, Spain; Tianjin, China; Mobile, United States; and Montreal, Canada. The company produces and markets the first commercially viable digital fly-by-wire airliner, the Airbus A320, and the world’s largest passenger airliner, the A380. The 12,000th aircraft, an A220, was delivered to Delta Air Lines on 20 May 2019. By October 2016, the global Airbus fleet have performed more than 110 million flights, totalling over 215 billion kilometres and carrying 12 billion passengers. Airbus’s registered headquarters is in Leiden, Netherlands, but its head office is located in Toulouse, France. The ‘SE’ in its corporate name means it is a societas Europaea, which enables it to be registered as European rather than Dutch. Its shares are traded in France, Germany and Spain. The company is led by CEO Guillaume Faury and is a component of the Euro Stoxx 50 stock market index. (https://en.wikipedia.org/wiki/Airbus)
How does Airbus SE develop in the past 12 months?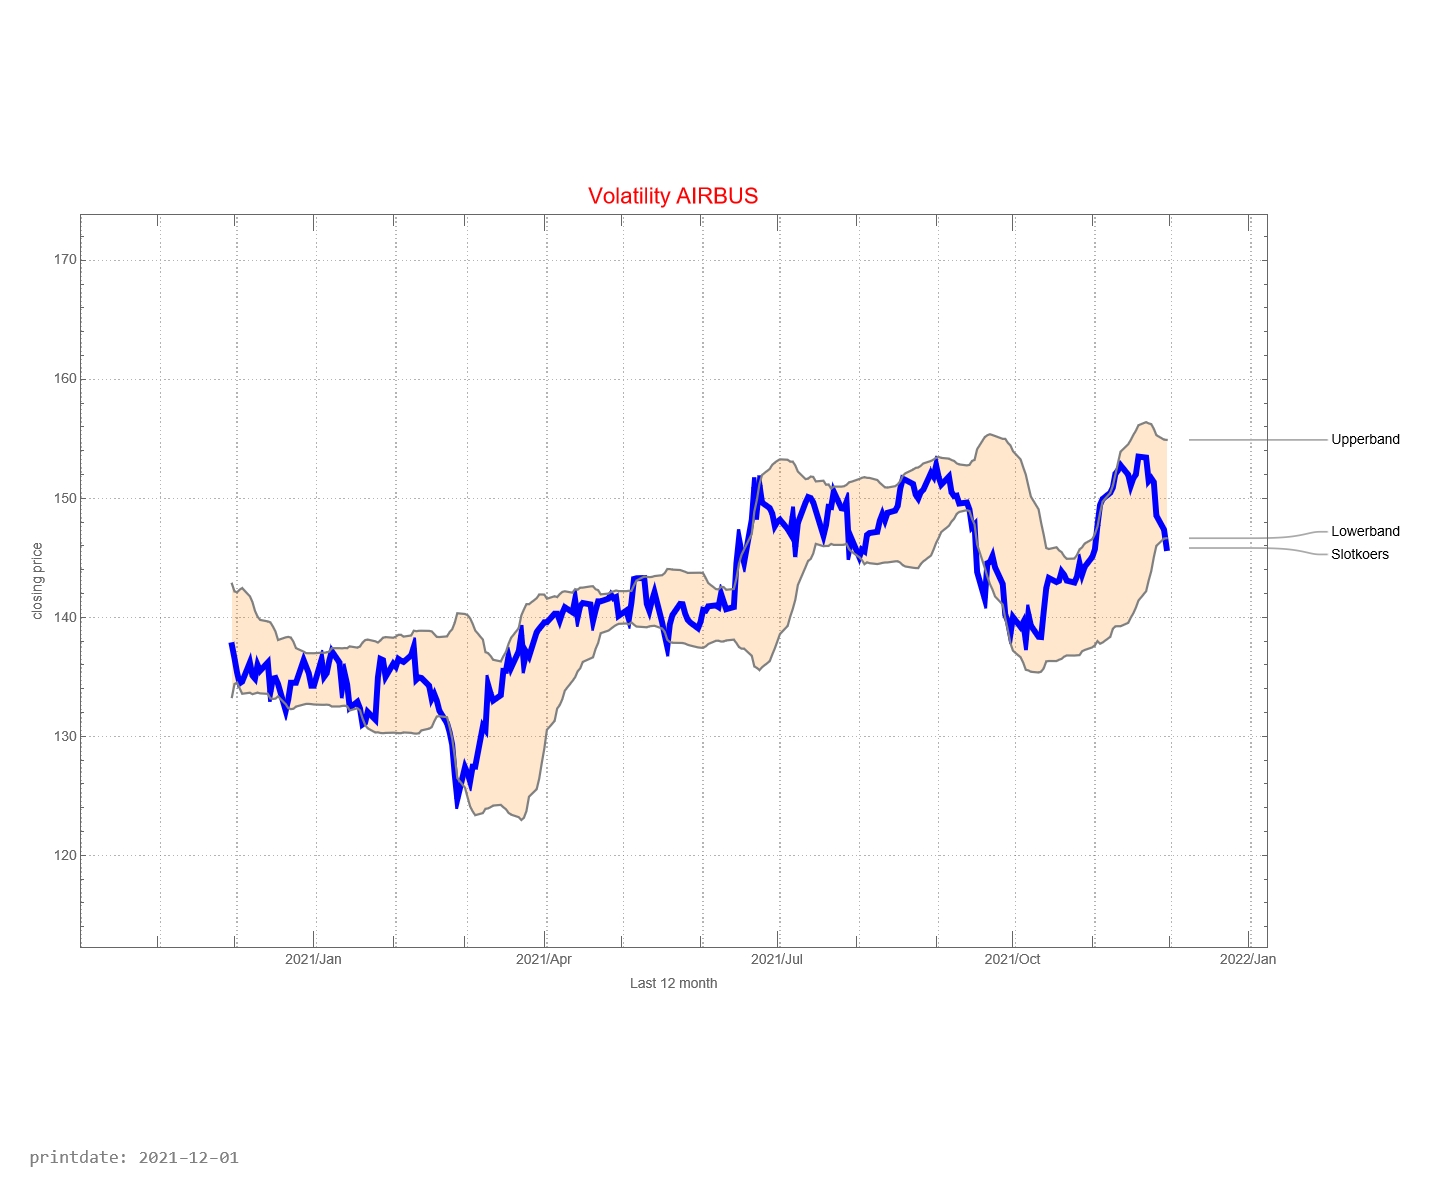
The graph below shows the history of issued buy and sell signals. The light blue part of the graph below shows the signals for the coming month. A red stop is “buy” and a blue dot is “sell”. The red line between buying and selling provides information about how long the Airbus SE fund has been in the portfolio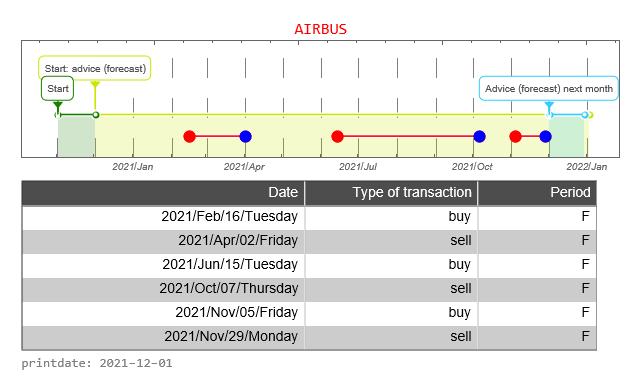
The graph below shows the buy and sell signals given in relation to the price development. In the table below you can see the date that a signal was issued, the type of signal (buy versus sell), whether the signal was issued in the forecast period, and the closing price of the stock on that day. The graph below, therefore, resembles the graph above to a certain extent, only without the forecast.![]()
![]()
The CAC40 is a weighted average of the most important 40 companies whose shares can be traded on the Paris Stock Exchange. It is now interesting to see how Airbus SE share compares with the CAC40. In the graph above, we do this by starting both prices at the same level. That is, the price is indexed to “1”.
How well is the Trading Robot doing? For this, we make a simulation of 12 months each time. We calculate the return the trading robot would have made if you had followed signals for this fund. And we compare the result with if you would do nothing. That is, on day one you buy the fund and 365 days you sell the stock.
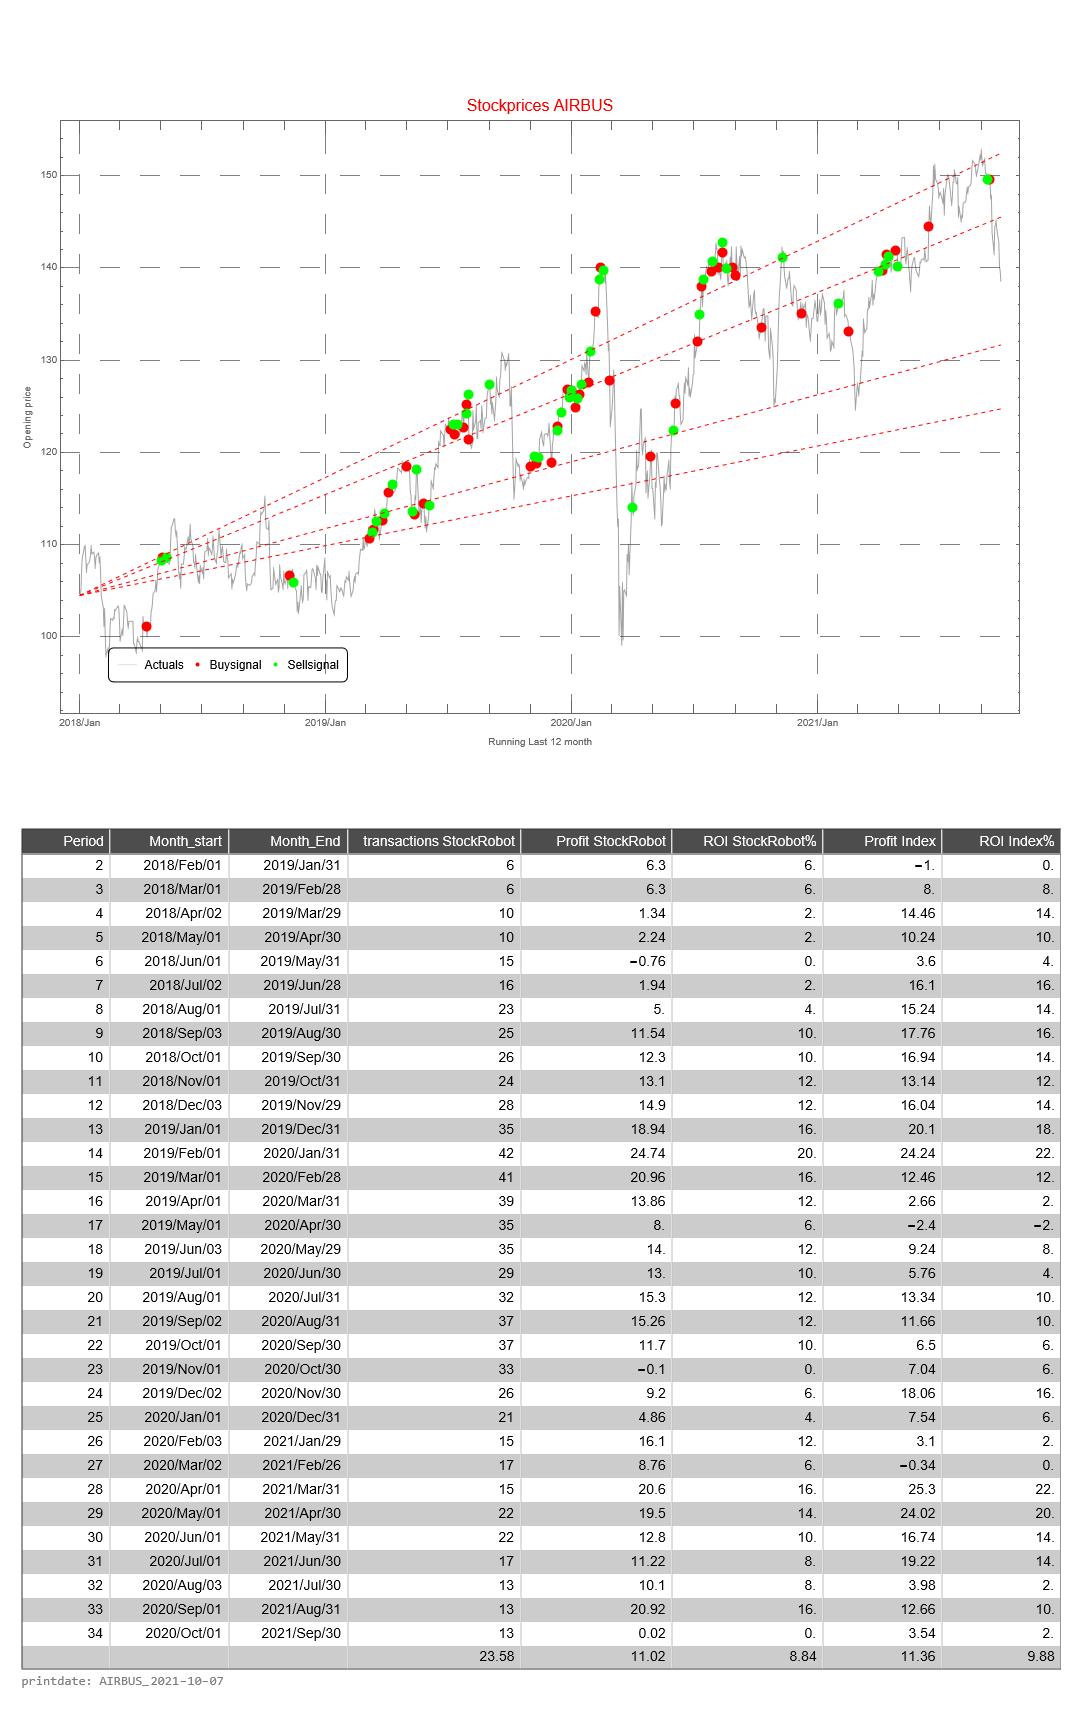
This simulation is repeated 31 times. The difference is that with each subsequent simulation the period shifts by one month. When shifting the 12 months, the simulation only looks at the buy and sell signals from that particular period.
The return of the Trading Robot is calculated as follows.
- the difference between the price of the fund between selling and buying (of 1 share of the relevant fund)
- we calculate the cumulative difference for multiple buy and sell signals
- if there has been no sell signal at the end of the 12-month period, we use the price on the last day of the 12-month period
- we calculate the average price value of a buy signal
- the cumulative difference divided by the average price is the return over the 12 months
The Profit HR (Trading Robot Profit) is the cumulative difference between buy and sell signals of 1 share of the relevant fund
The return of the Trading Robot is the Profit over the last 12 month divided by the price value of the first day of a 12-month period of the relevant fund