[vc_row][vc_column][vc_tta_tabs]
[vc_tta_section title=”Price trend” tab_id=”1″]
[vc_column_text]
ForFarmers is internationally active and market leader in Europe in the field of conventional and organic feed solutions for livestock farming. In addition to animal feed for the cattle, pig, poultry and horse sectors, ForFarmers supplies trade products for arable and pasture farming and offers customers additional knowledge and advice in the field of nutrition, animal husbandry and business development.
How does ForFarmers develop in the past 12 months?
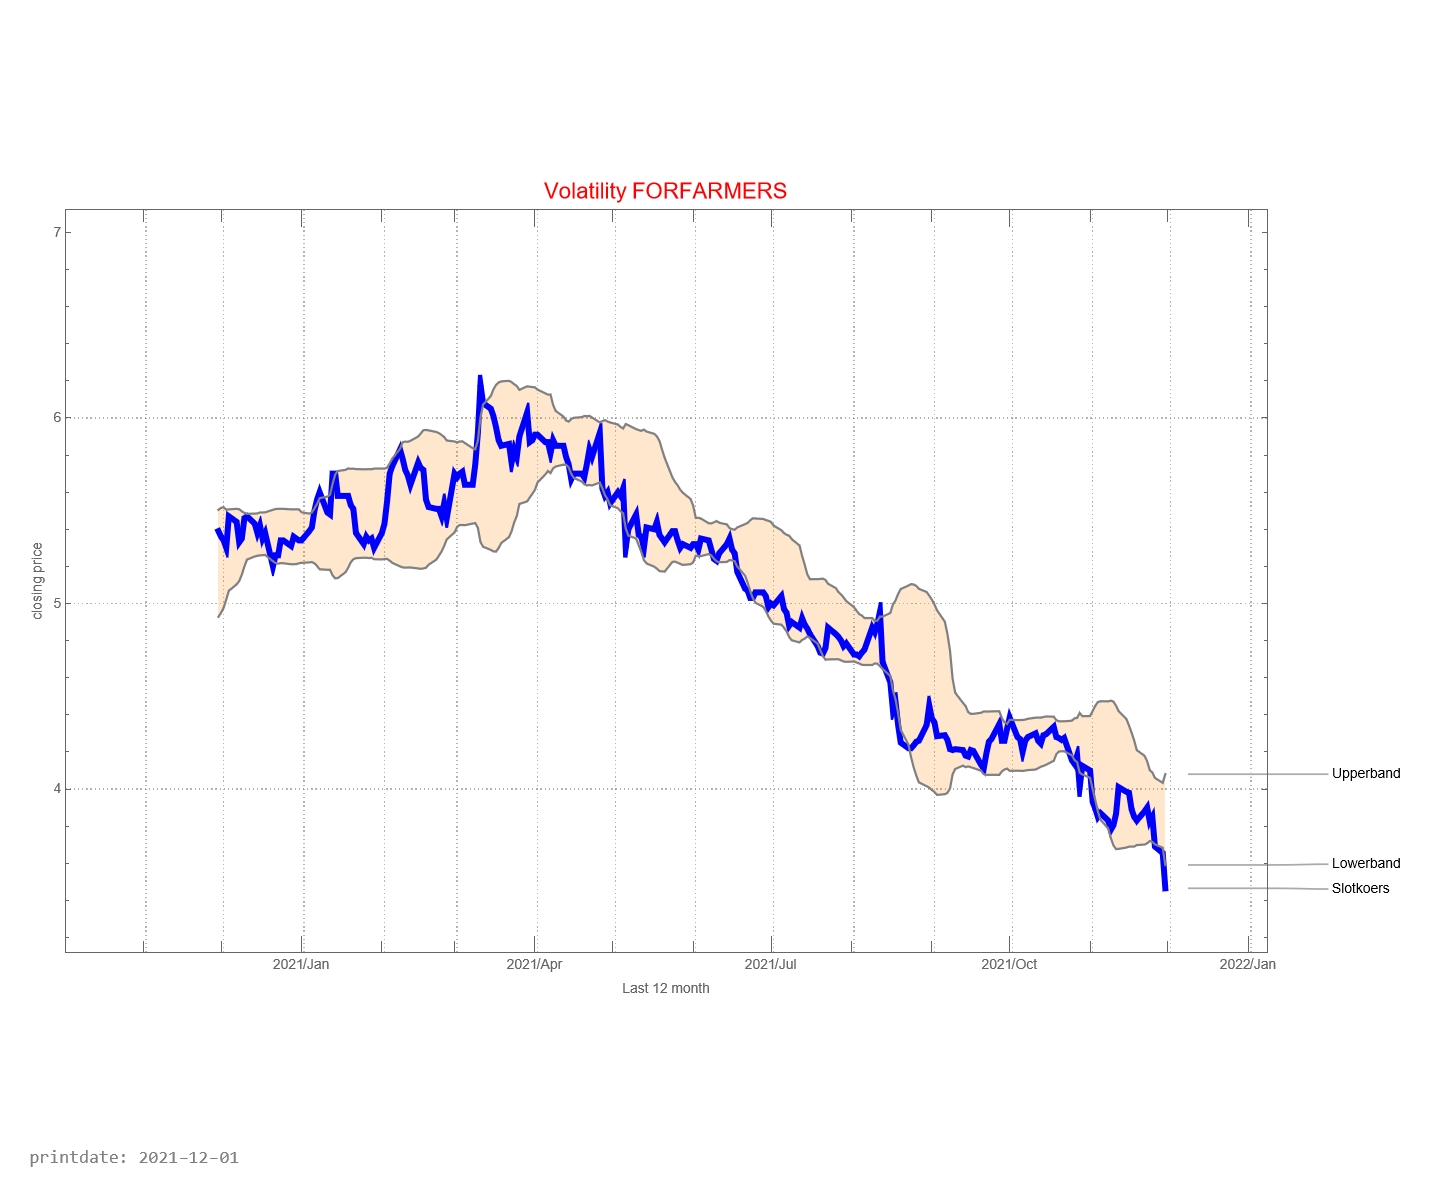
The graph below shows the history of issued buy and sell signals. The light blue part of the graph below shows the signals for the coming month. A red stop is “buy” and a blue dot is “sell”. The red line between buying and selling provides information about how long the ForFarmers fund has been in the portfolio
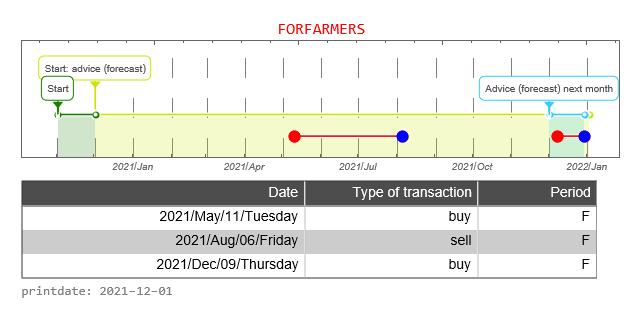
The graph below shows the buy and sell signals given in relation to the price development. In the table below you can see the date that a signal was issued, the type of signal (buy versus sell), whether the signal was issued in the forecast period, and the closing price of the stock on that day. The graph below, therefore, resembles the graph above to a certain extent, only without the forecast.
![]()
[/vc_column_text][/vc_tta_section]
[vc_tta_section title=”Price in relation to the Index” tab_id=”2″]
[vc_column_text]
![]()
The ASX-index is a weighted average of the most important 29 companies whose shares can be traded on the Amsterdam Stock Exchange. It is now interesting to see how ForFarmers share compares with the ASX-index. In the graph above, we do this by starting both prices at the same level. That is, the price is indexed to “1”.
[/vc_column_text][/vc_tta_section]
[vc_tta_section title=”Yield trading robot” tab_id=”3″]
[vc_column_text]
How well is the Trading Robot doing? For this, we make a simulation of 12 months each time. We calculate the return the trading robot would have made if you had followed signals for this fund. And we compare the result with if you would do nothing. That is, on day one you buy the fund and 365 days you sell the stock.
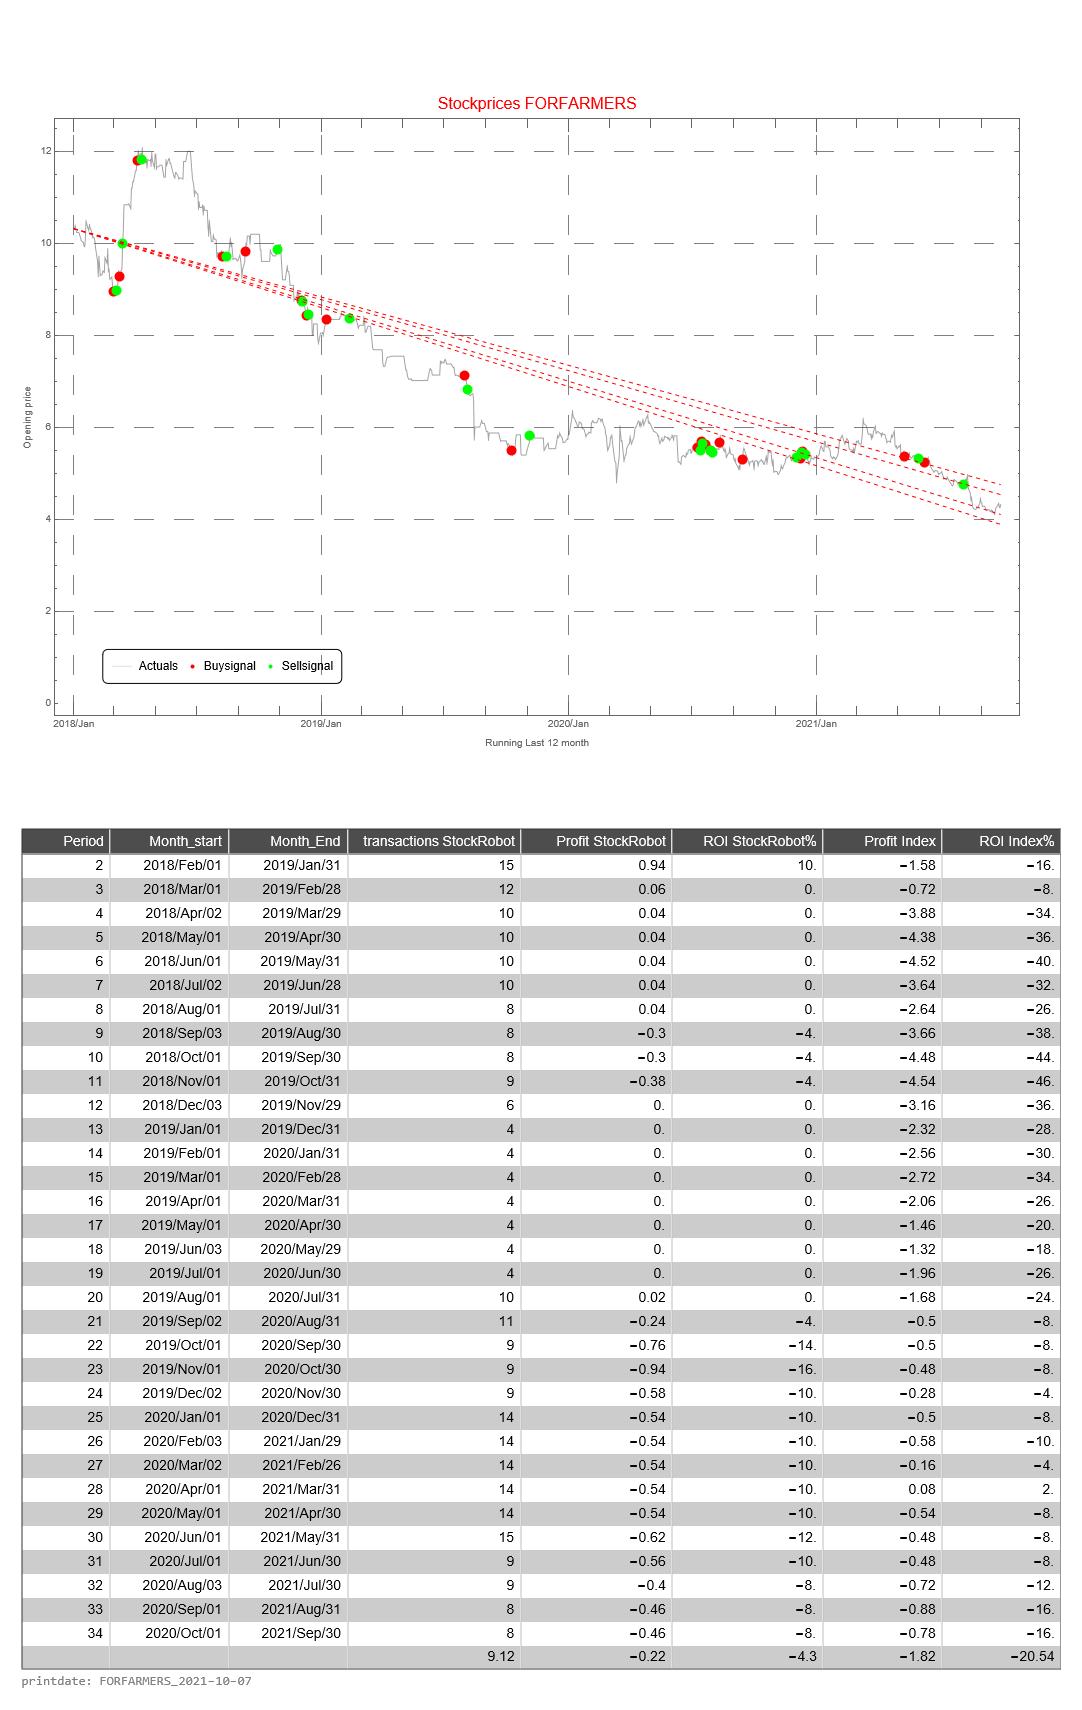
This simulation is repeated 31 times. The difference is that with each subsequent simulation the period shifts by one month. When shifting the 12 months, the simulation only looks at the buy and sell signals from that particular period.
The return of the Trading Robot is calculated as follows.
- the difference between the price of the fund between selling and buying (of 1 share of the relevant fund)
- we calculate the cumulative difference for multiple buy and sell signals
- if there has been no sell signal at the end of the 12-month period, we use the price on the last day of the 12-month period
- we calculate the average price value of a buy signal
- the cumulative difference divided by the average price is the return over the 12 months
The Profit HR (Trading Robot Profit) is the cumulative difference between buy and sell signals of 1 share of the relevant fund
The return of the Trading Robot is the Profit over the last 12 month divided by the price value of the first day of a 12-month period of the relevant fund
[/vc_column_text][/vc_tta_section]
[/vc_tta_tabs][/vc_column][/vc_row]
ForFarmers is internationally active and market leader in Europe in the field of conventional and organic feed solutions for livestock farming. In addition to animal feed for the cattle, pig, poultry and horse sectors, ForFarmers supplies trade products for arable and pasture farming and offers customers additional knowledge and advice in the field of nutrition, animal husbandry and business development.
How does ForFarmers develop in the past 12 months?
The graph below shows the history of issued buy and sell signals. The light blue part of the graph below shows the signals for the coming month. A red stop is “buy” and a blue dot is “sell”. The red line between buying and selling provides information about how long the ForFarmers fund has been in the portfolio
The graph below shows the buy and sell signals given in relation to the price development. In the table below you can see the date that a signal was issued, the type of signal (buy versus sell), whether the signal was issued in the forecast period, and the closing price of the stock on that day. The graph below, therefore, resembles the graph above to a certain extent, only without the forecast.![]()
![]()
The ASX-index is a weighted average of the most important 29 companies whose shares can be traded on the Amsterdam Stock Exchange. It is now interesting to see how ForFarmers share compares with the ASX-index. In the graph above, we do this by starting both prices at the same level. That is, the price is indexed to “1”.
How well is the Trading Robot doing? For this, we make a simulation of 12 months each time. We calculate the return the trading robot would have made if you had followed signals for this fund. And we compare the result with if you would do nothing. That is, on day one you buy the fund and 365 days you sell the stock.
This simulation is repeated 31 times. The difference is that with each subsequent simulation the period shifts by one month. When shifting the 12 months, the simulation only looks at the buy and sell signals from that particular period.
The return of the Trading Robot is calculated as follows.
- the difference between the price of the fund between selling and buying (of 1 share of the relevant fund)
- we calculate the cumulative difference for multiple buy and sell signals
- if there has been no sell signal at the end of the 12-month period, we use the price on the last day of the 12-month period
- we calculate the average price value of a buy signal
- the cumulative difference divided by the average price is the return over the 12 months
The Profit HR (Trading Robot Profit) is the cumulative difference between buy and sell signals of 1 share of the relevant fund
The return of the Trading Robot is the Profit over the last 12 month divided by the price value of the first day of a 12-month period of the relevant fund