TotalEnergies SE is a French multinational integrated oil and gas company founded in 1924 and one of the seven “supermajor” oil companies. Its businesses cover the entire oil and gas chain, from crude oil and natural gas exploration and production to power generation, transportation, refining, petroleum product marketing, and international crude oil and product trading. TotalEnergies is also a large-scale chemicals manufacturer.TotalEnergies has its head office in the Tour Total in La Défense district in Courbevoie, west of Paris. The company is a component of the Euro Stoxx 50 stock market index. In the 2020 Forbes Global 2000, it was ranked as the 29th-largest public company in the world, and additionally ranked as the 25th largest company of any type on the Fortune Global 500. Like other fossil fuel companies, TotalEnergies has a complex history of environmental and social impacts, including multiple controversies. According to the CDP Carbon Majors Report 2017, the company was one of the top 100 companies producing carbon emissions globally, responsible for .9% of global emissions from 1998-2015. (https://en.wikipedia.org/wiki/TotalEnergies)
How does TotalEnergies develop in the past 12 months?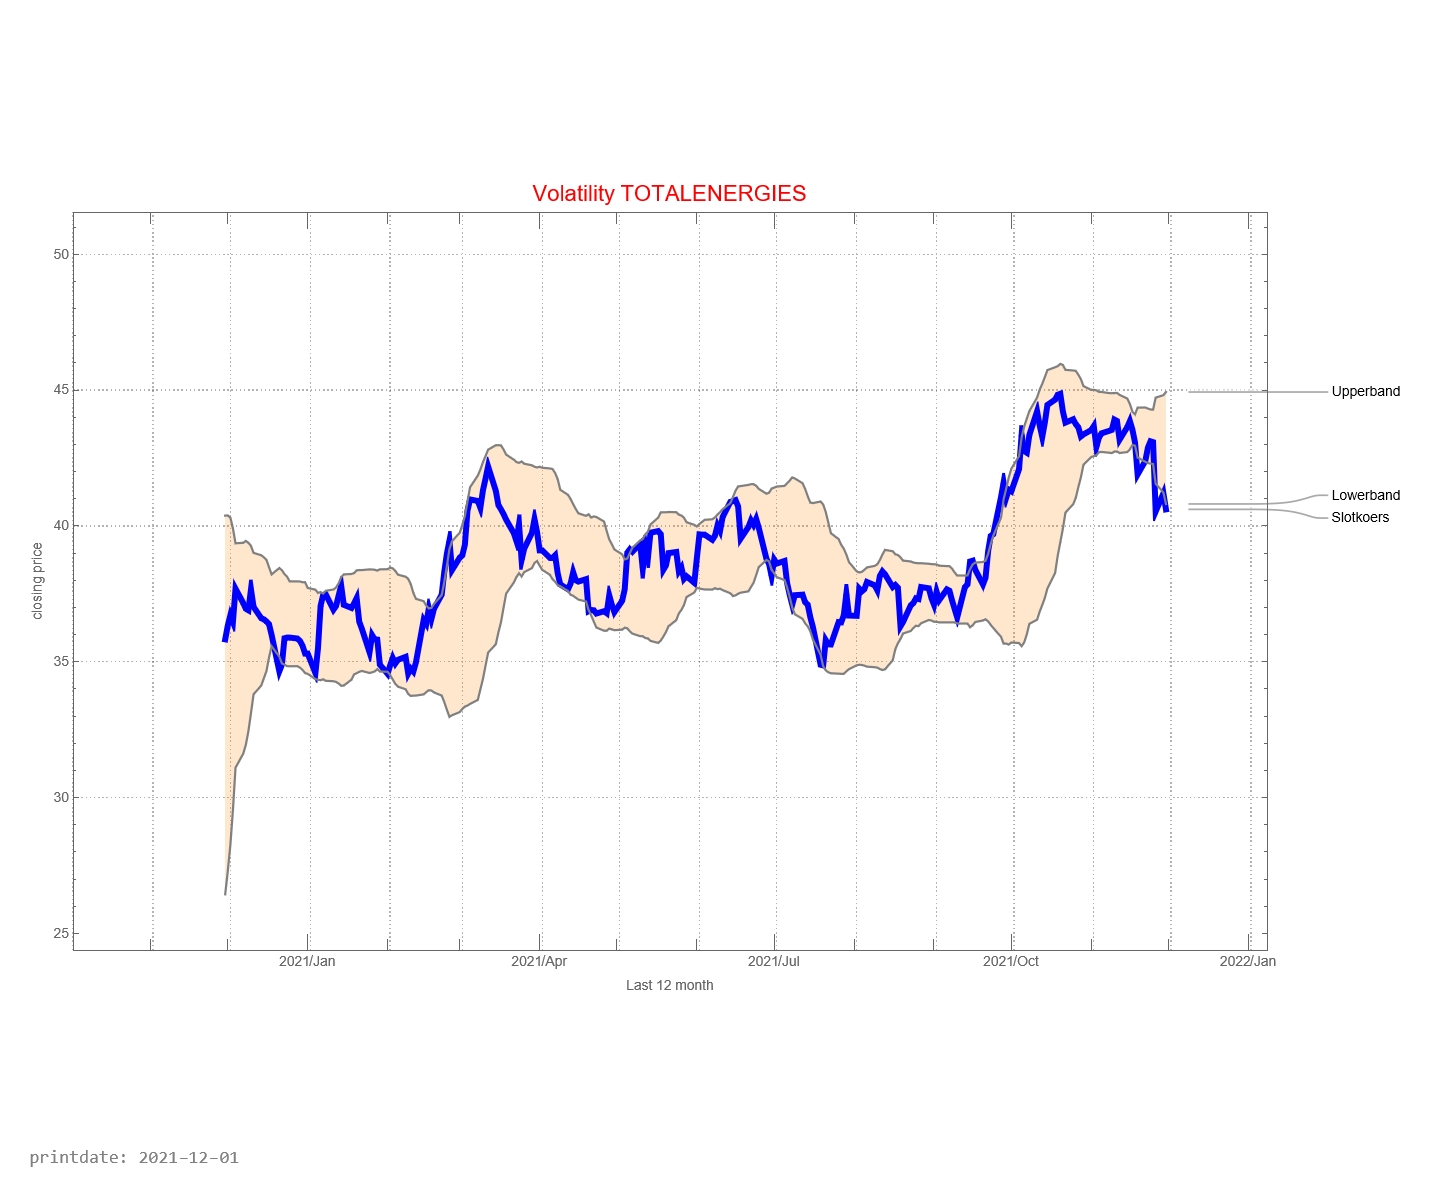
The graph below shows the history of issued buy and sell signals. The light blue part of the graph below shows the signals for the coming month. A red stop is “buy” and a blue dot is “sell”. The red line between buying and selling provides information about how long the TotalEnergies fund has been in the portfolio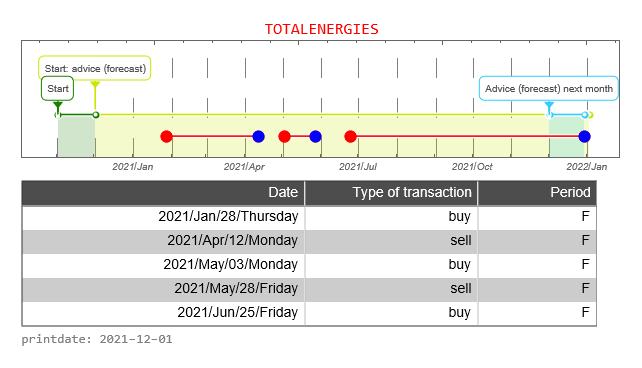
The graph below shows the buy and sell signals given in relation to the price development. In the table below you can see the date that a signal was issued, the type of signal (buy versus sell), whether the signal was issued in the forecast period, and the closing price of the stock on that day. The graph below, therefore, resembles the graph above to a certain extent, only without the forecast.![]()
![]()
The CAC40 is a weighted average of the most important 40 companies whose shares can be traded on the Paris Stock Exchange. It is now interesting to see how TotalEnergies share compares with the CAC40. In the graph above, we do this by starting both prices at the same level. That is, the price is indexed to “1”.
How well is the Trading Robot doing? For this, we make a simulation of 12 months each time. We calculate the return the trading robot would have made if you had followed signals for this fund. And we compare the result with if you would do nothing. That is, on day one you buy the fund and 365 days you sell the stock.
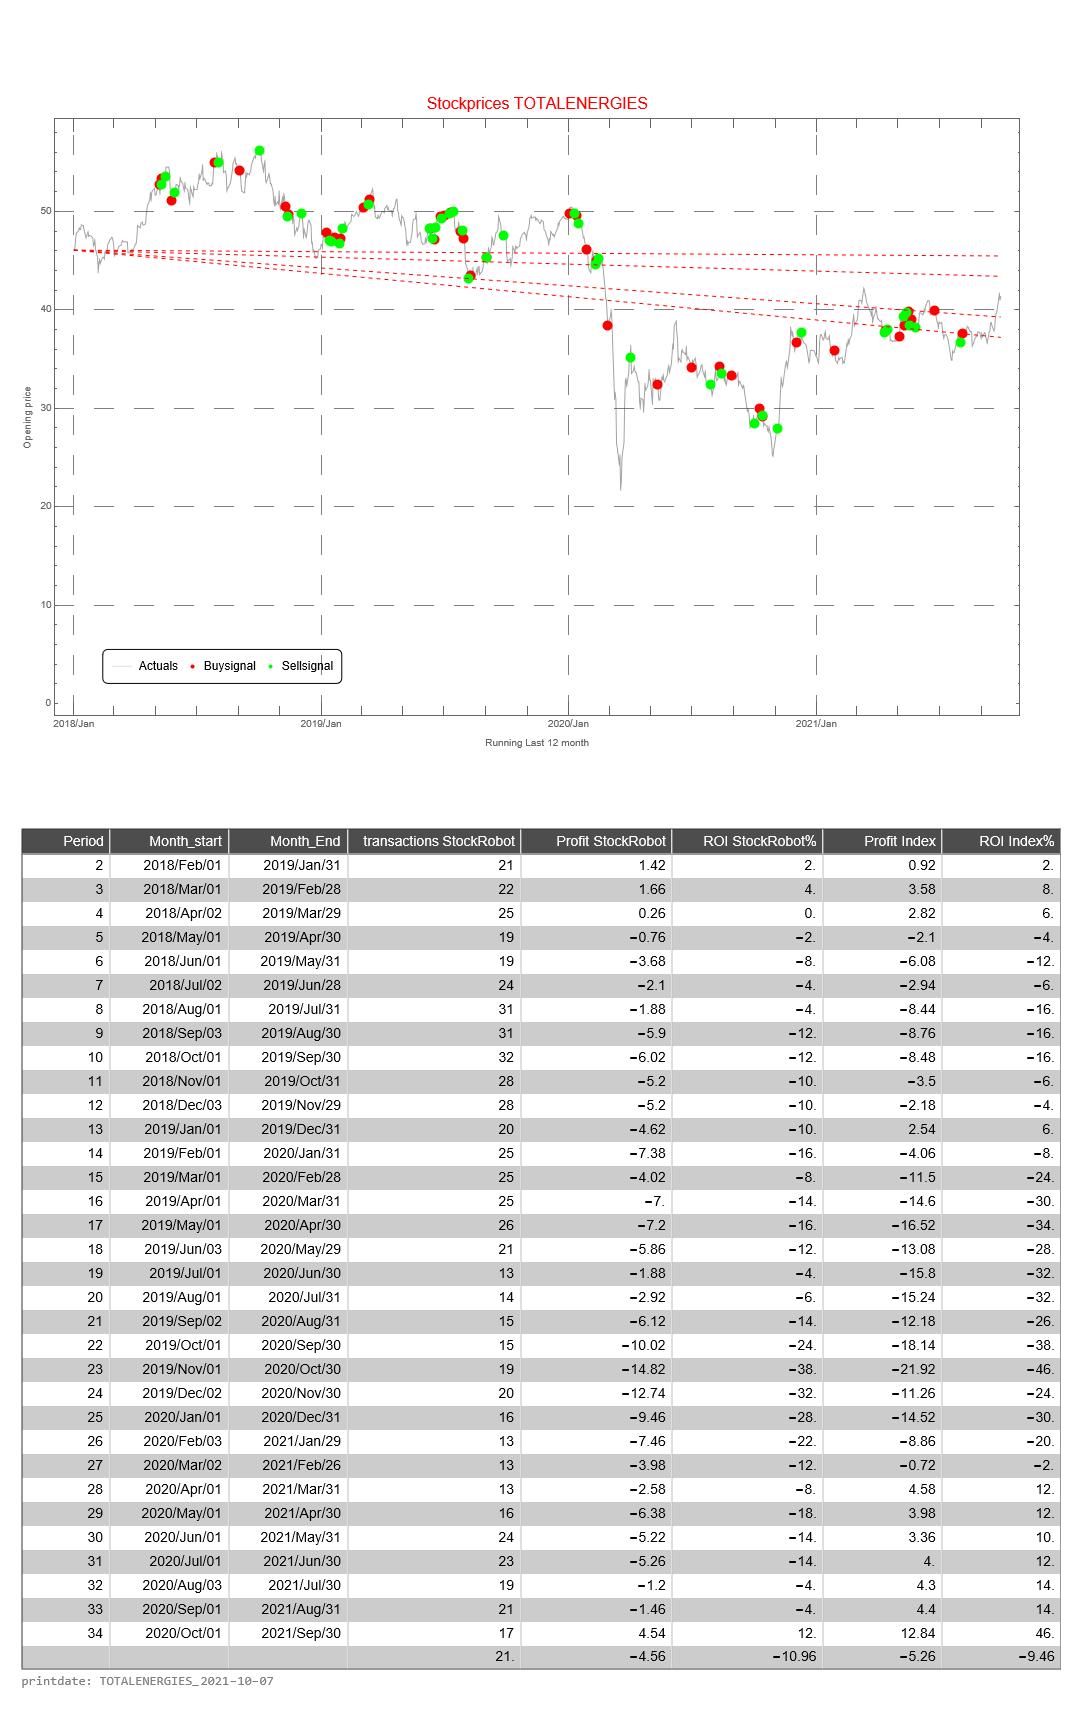
This simulation is repeated 31 times. The difference is that with each subsequent simulation the period shifts by one month. When shifting the 12 months, the simulation only looks at the buy and sell signals from that particular period.
The return of the Trading Robot is calculated as follows.
- the difference between the price of the fund between selling and buying (of 1 share of the relevant fund)
- we calculate the cumulative difference for multiple buy and sell signals
- if there has been no sell signal at the end of the 12-month period, we use the price on the last day of the 12-month period
- we calculate the average price value of a buy signal
- the cumulative difference divided by the average price is the return over the 12 months
The Profit HR (Trading Robot Profit) is the cumulative difference between buy and sell signals of 1 share of the relevant fund
The return of the Trading Robot is the Profit over the last 12 month divided by the price value of the first day of a 12-month period of the relevant fund