The table below shows the buy, hold and sell signals for the PSI20 funds for the coming month. A ‘keep’ signal means that the fund was bought in a previous period and will remain in the portfolio for the next month. A ‘buy signal’ means that the algorithm will buy the relevant stock. In the event of a ‘sell signal’, the robot will sell the relevant share. Not every fund in the PSI20 receives a signal. If the ‘signal’ is ‘empty’, it is possible that the fund has been sold earlier and that no new buy signals have been issued. The algorithm ‘sees’ no reason to buy the fund for the coming month.
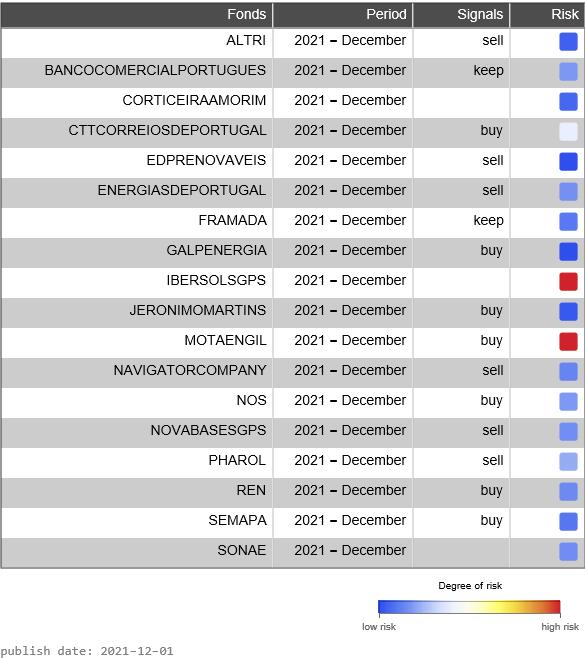
The risk indicator is based on the degree of volatility and trend price development over the last 4 months
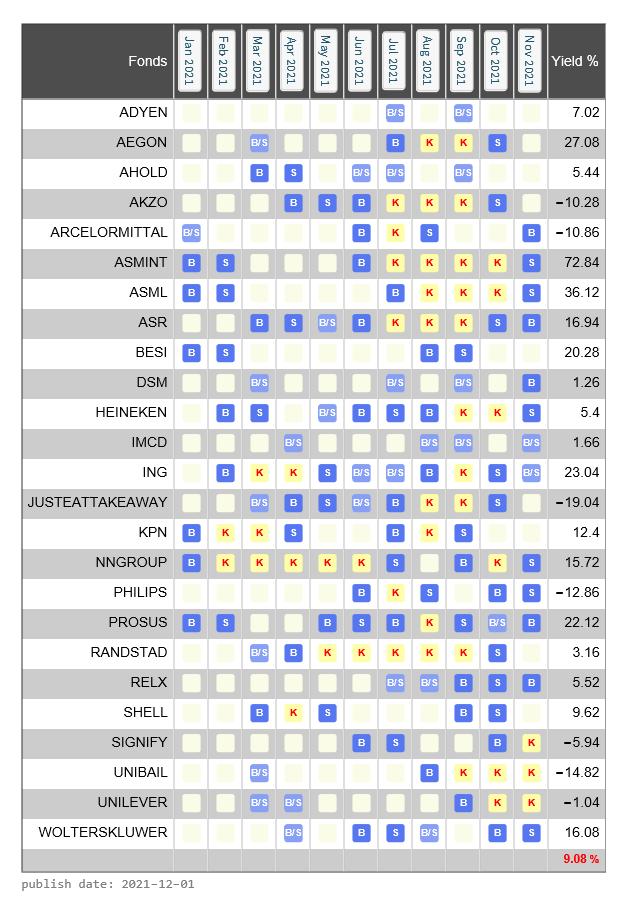
The table below provides insight into the transactions per month over the past 12 months for each fund. It concerns transactions as generated by the algorithm. The last column is the return achieved for that fund over the last 12 months (not including current month). The last line is the average return over all funds of this exchange.
- B: Buy
- S: Sell
- K: Keep
- B/S: Buy/Sell (in the same month)
- White box: no transactions that month
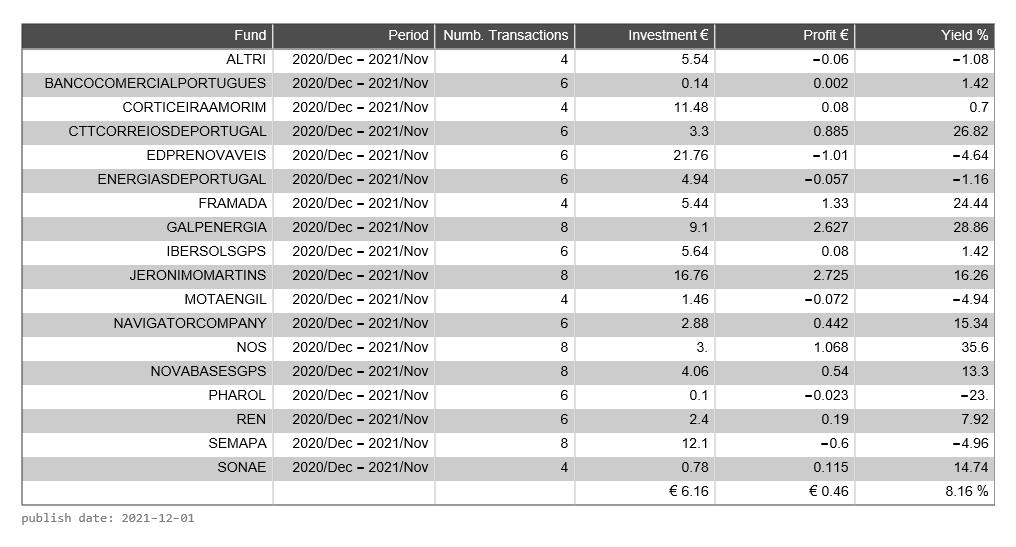
The table below provides an overview of the returns achieved by the algorithm. This is the result you would have achieved if you followed all of the algorithm’s buy, hold, and sell signals over the past period. The ‘investment’ column is the average value of one share in the last 12 months. It is an average because the algorithm may have bought stock multiple times. The ‘profit’ column is the average profit over one share. The ‘yield’ column is the percentage gain that the algorithm has made over the past 12 months, broken down into the different funds. At the bottom of the table, you see the overall result achieved.