Ibersol SGPS SA is a Portugal-based company primarily engaged in the operation of restaurants. It is active in Portugal and Spain. The Company divides its activities into six business areas: Restaurants and Delivery; Counters; Travel; Coffee Kiosks; Catering, and Concessions. In the Restaurants and Delivery area, it is involved in the operation of restaurant chains under brand names of Pizza Hut, Pasta Caffe and Pizza Movil. In the Counters area, it operates restaurant chains under banners KFC, O Kilo, Burger King and Pans, as well as The Eat-Out Group brand names. The Travel business sector includes the provision of foodservices on highways and airports. The Coffee Kiosks sector consists of coffee retailers under the brand name Delta. In the Catering sector, it is active in the preparation of meals. The Concessions sector includes the management of concessions for provision of foodservices in number of spots in Portugal, such as Serralves Museum and Casa da Musica, among others. (https://www.reuters.com/companies/IBS.LS)
How does IbersolSGPS develop in the past 12 months?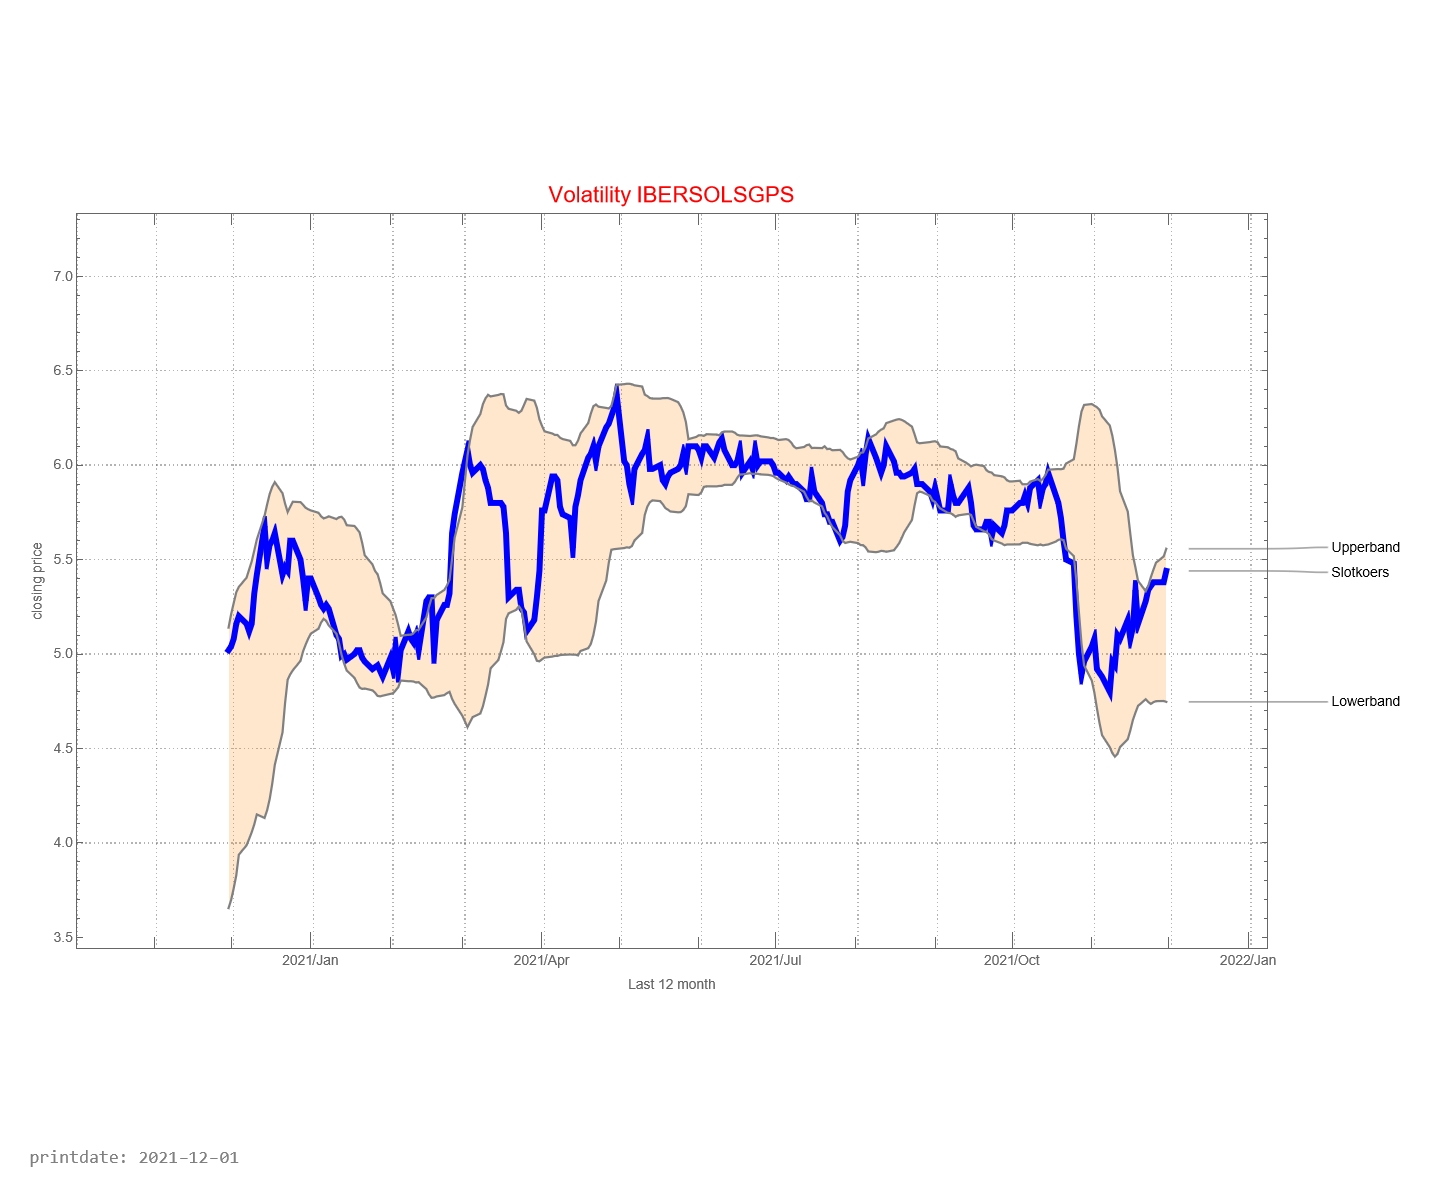
The graph below shows the history of issued buy and sell signals. The light blue part of the graph below shows the signals for the coming month. A red stop is “buy” and a blue dot is “sell”. The red line between buying and selling provides information about how long the IbersolSGPS fund has been in the portfolio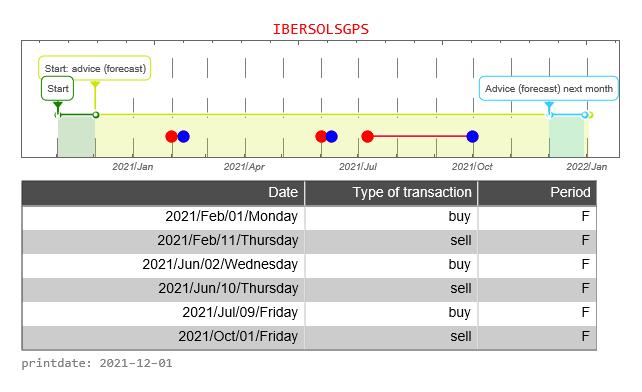
The graph below shows the buy and sell signals given in relation to the price development. In the table below you can see the date that a signal was issued, the type of signal (buy versus sell), whether the signal was issued in the forecast period, and the closing price of the stock on that day. The graph below, therefore, resembles the graph above to a certain extent, only without the forecast.![]()
![]()
The PSI20 is a weighted average of the most important 18 companies whose shares can be traded on the Lisbon Stock Exchange. It is now interesting to see how IbersolSGPS share compares with the PSI20. In the graph above, we do this by starting both prices at the same level. That is, the price is indexed to “1”.
How well is the Trading Robot doing? For this, we make a simulation of 12 months each time. We calculate the return the trading robot would have made if you had followed signals for this fund. And we compare the result with if you would do nothing. That is, on day one you buy the fund and 365 days you sell the stock.
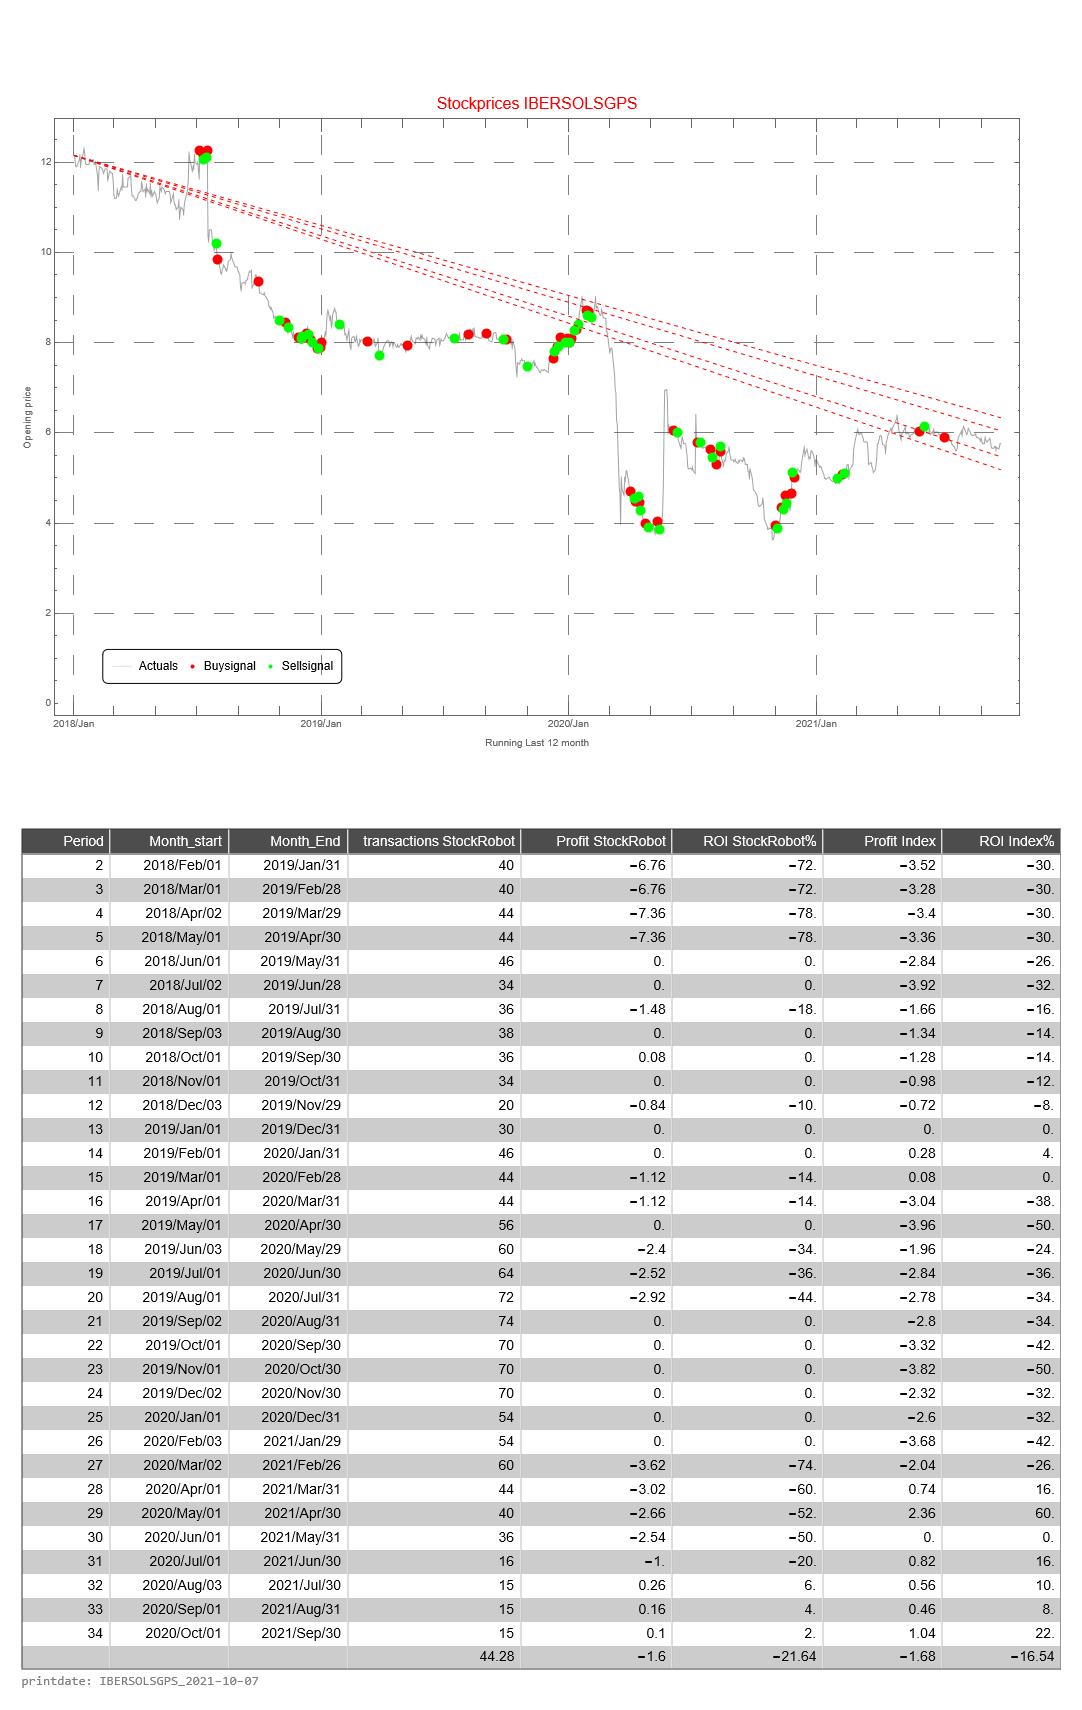
This simulation is repeated 31 times. The difference is that with each subsequent simulation the period shifts by one month. When shifting the 12 months, the simulation only looks at the buy and sell signals from that particular period.
The return of the Trading Robot is calculated as follows.
- the difference between the price of the fund between selling and buying (of 1 share of the relevant fund)
- we calculate the cumulative difference for multiple buy and sell signals
- if there has been no sell signal at the end of the 12-month period, we use the price on the last day of the 12-month period
- we calculate the average price value of a buy signal
- the cumulative difference divided by the average price is the return over the 12 months
The Profit HR (Trading Robot Profit) is the cumulative difference between buy and sell signals of 1 share of the relevant fund
The return of the Trading Robot is the Profit over the last 12 month divided by the price value of the first day of a 12-month period of the relevant fund