HeidelbergCement is a German multinational building materials company headquartered in Heidelberg, Germany. It is a DAX corporation and is one of the largest building materials companies in the world. On 1 July 2016, HeidelbergCement AG completed the acquisition of a 45% shareholding in Italcementi. That acquisition made HeidelbergCement the number one producer of construction aggregates, the number 2 in cement and number 3 in ready mixed concrete worldwide. In the 2020 Forbes Global 2000, HeidelbergCement was ranked as the 678th -largest public company in the world. The enlarged group has activities in around 60 countries with 57,000 employees working at 3,000 production sites. HeidelbergCement operates 139 cement plants with an annual cement capacity of 176 million tonnes, more than 1,500 ready-mixed concrete production sites, and over 600 aggregates quarries. (https://en.wikipedia.org/wiki/HeidelbergCement)
How does HeidelbergCement develop in the past 12 months?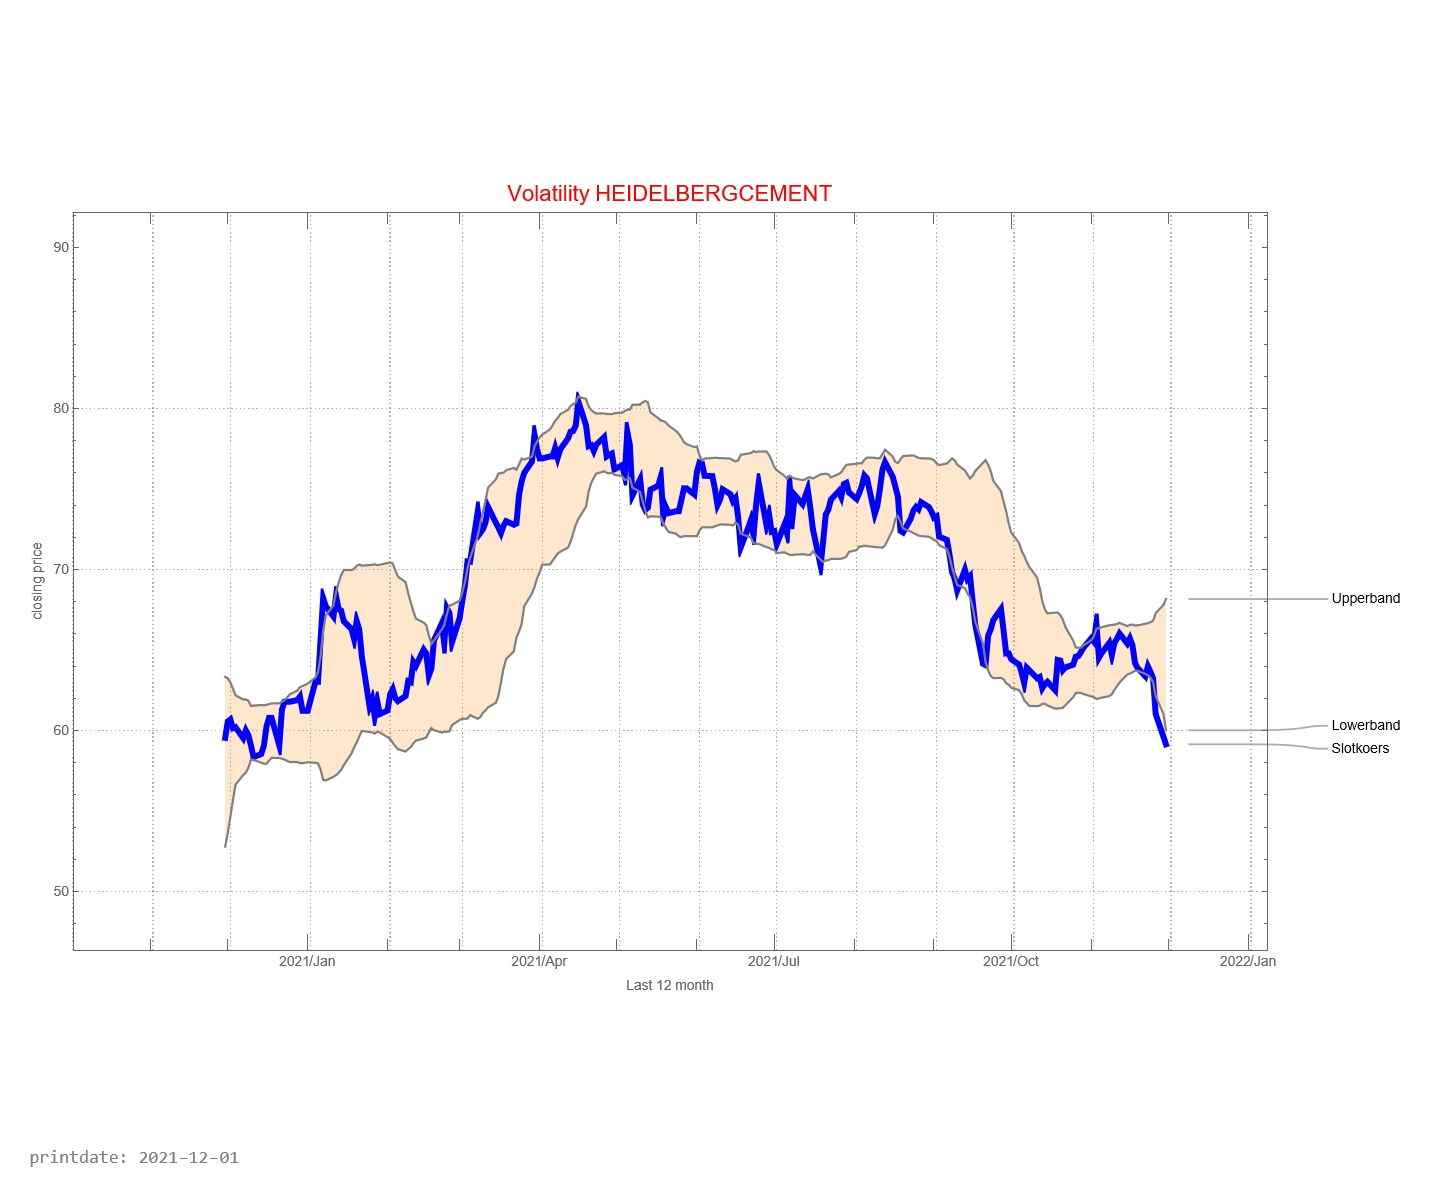
The graph below shows the history of issued buy and sell signals. The light blue part of the graph below shows the signals for the coming month. A red stop is “buy” and a blue dot is “sell”. The red line between buying and selling provides information about how long the HeidelbergCement fund has been in the portfolio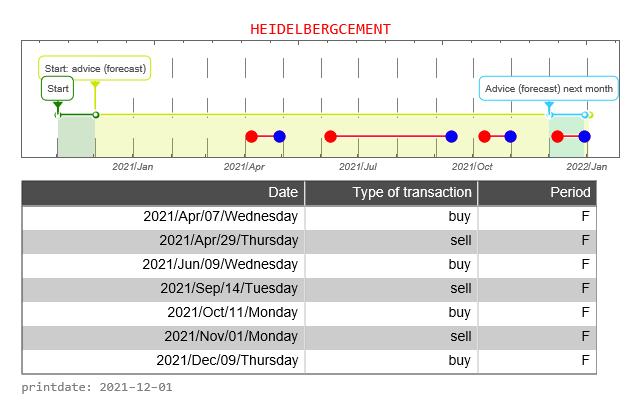
The graph below shows the buy and sell signals given in relation to the price development. In the table below you can see the date that a signal was issued, the type of signal (buy versus sell), whether the signal was issued in the forecast period, and the closing price of the stock on that day. The graph below, therefore, resembles the graph above to a certain extent, only without the forecast.![]()
![]()
The DAX30 is a weighted average of the most important 30 companies whose shares can be traded on the Frankfurt Stock Exchange. It is now interesting to see how HeidelbergCement share compares with the DAX30. In the graph above, we do this by starting both prices at the same level. That is, the price is indexed to “1”.
How well is the Trading Robot doing? For this, we make a simulation of 12 months each time. We calculate the return the trading robot would have made if you had followed signals for this fund. And we compare the result with if you would do nothing. That is, on day one you buy the fund and 365 days you sell the stock.
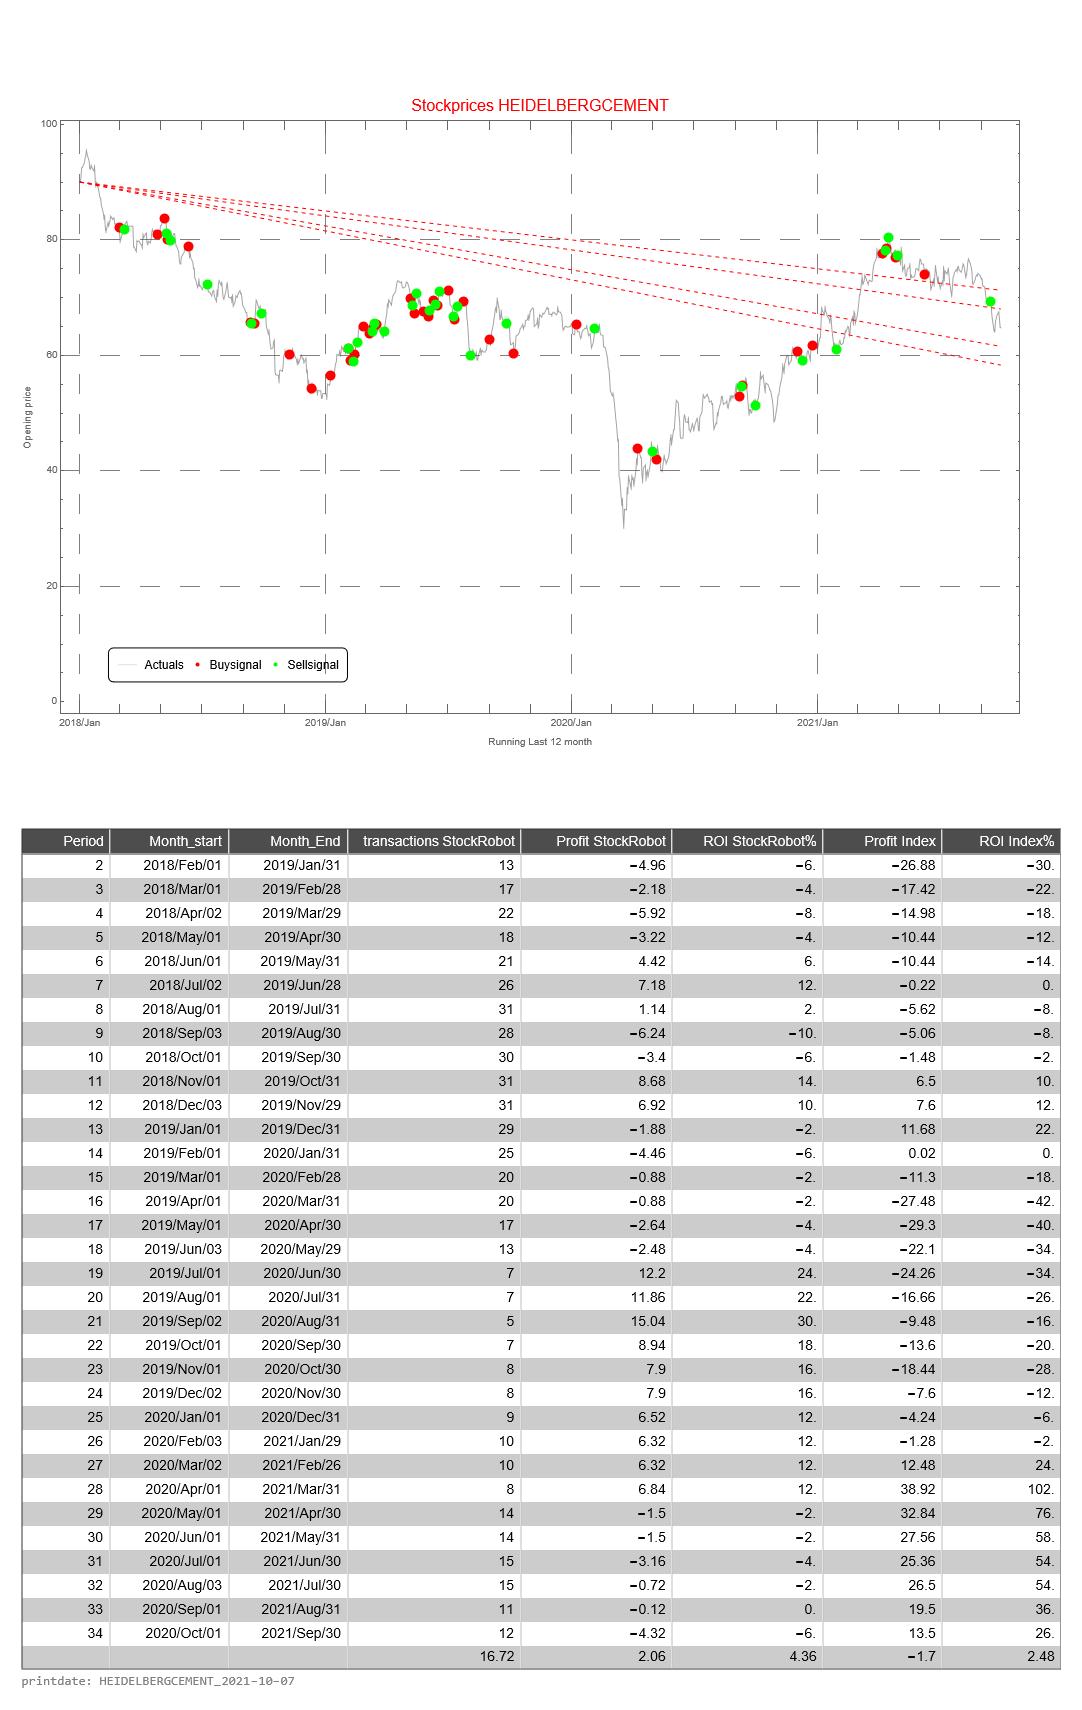
This simulation is repeated 31 times. The difference is that with each subsequent simulation the period shifts by one month. When shifting the 12 months, the simulation only looks at the buy and sell signals from that particular period.
The return of the Trading Robot is calculated as follows.
- the difference between the price of the fund between selling and buying (of 1 share of the relevant fund)
- we calculate the cumulative difference for multiple buy and sell signals
- if there has been no sell signal at the end of the 12-month period, we use the price on the last day of the 12-month period
- we calculate the average price value of a buy signal
- the cumulative difference divided by the average price is the return over the 12 months
The Profit HR (Trading Robot Profit) is the cumulative difference between buy and sell signals of 1 share of the relevant fund
The return of the Trading Robot is the Profit over the last 12 month divided by the price value of the first day of a 12-month period of the relevant fund