Bayerische Motoren Werke AG, commonly referred to as BMW, is a German multinational corporation which produces luxury vehicles and motorcycles. The company was founded in 1916 as a manufacturer of aircraft engines, which it produced from 1917 until 1918 and again from 1933 to 1945. Automobiles are marketed under the brands BMW, Mini and Rolls-Royce, and motorcycles are marketed under the brand BMW Motorrad. In 2017, BMW was the world’s fourteenth-largest producer of motor vehicles, with 2,279,503 vehicles produced.[3] The company has significant motorsport history, especially in touring cars, Formula 1, sports cars and the Isle of Man TT. BMW is headquartered in Munich and produces motor vehicles in Germany, Brazil, China, India, Mexico, the Netherlands, South Africa, the United Kingdom, and the United States. The Quandt family is a long-term shareholder of the company (with the remaining shares owned by public float), following brothers Herbert and Harald Quandt’s investments in 1959 which saved the company from bankruptcy. (source: https://en.wikipedia.org/wiki/BMW)
How does Bayerische Motoren Werke (BMW) develop in the past 12 months?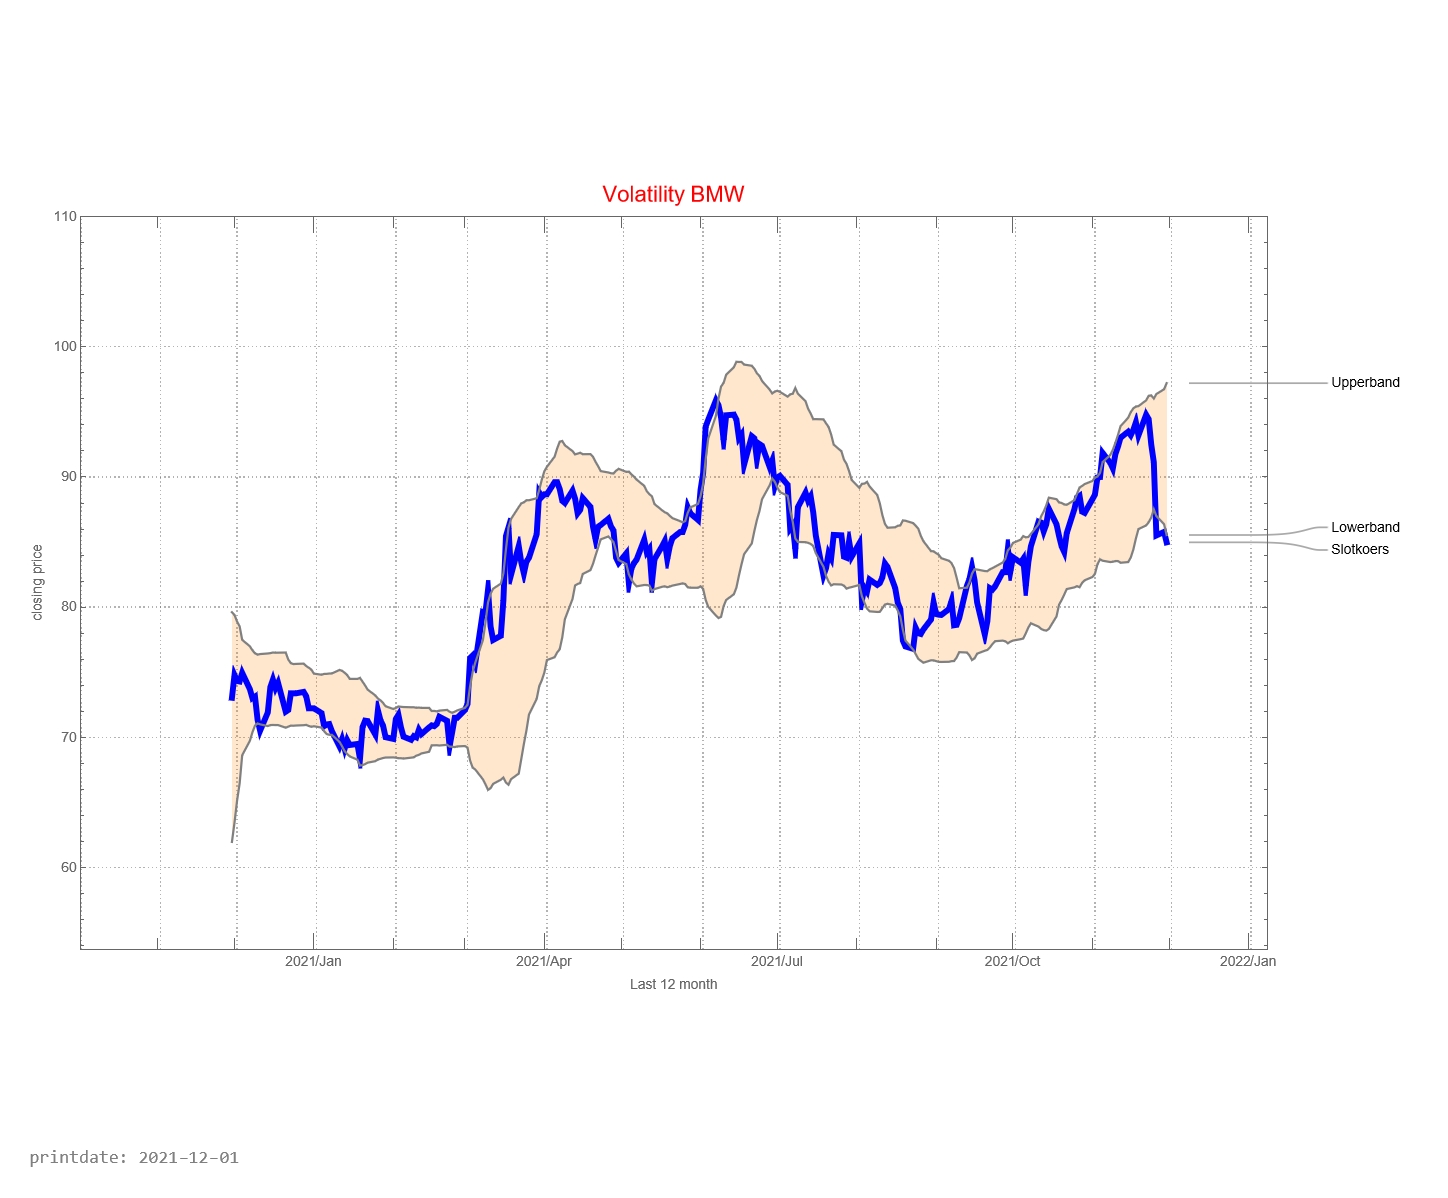
The graph below shows the history of issued buy and sell signals. The light blue part of the graph below shows the signals for the coming month. A red stop is “buy” and a blue dot is “sell”. The red line between buying and selling provides information about how long the Bayerische Motoren Werke (BMW) fund has been in the portfolio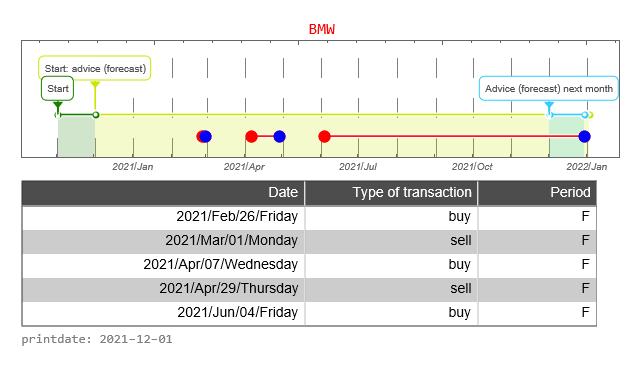
The graph below shows the buy and sell signals given in relation to the price development. In the table below you can see the date that a signal was issued, the type of signal (buy versus sell), whether the signal was issued in the forecast period, and the closing price of the stock on that day. The graph below, therefore, resembles the graph above to a certain extent, only without the forecast.![]()
![]()
The DAX30 is a weighted average of the most important 30 companies whose shares can be traded on the Frankfurt Stock Exchange. It is now interesting to see how Bayerische Motoren Werke (BMW) share compares with the DAX30. In the graph above, we do this by starting both prices at the same level. That is, the price is indexed to “1”.
How well is the Trading Robot doing? For this, we make a simulation of 12 months each time. We calculate the return the trading robot would have made if you had followed signals for this fund. And we compare the result with if you would do nothing. That is, on day one you buy the fund and 365 days you sell the stock.
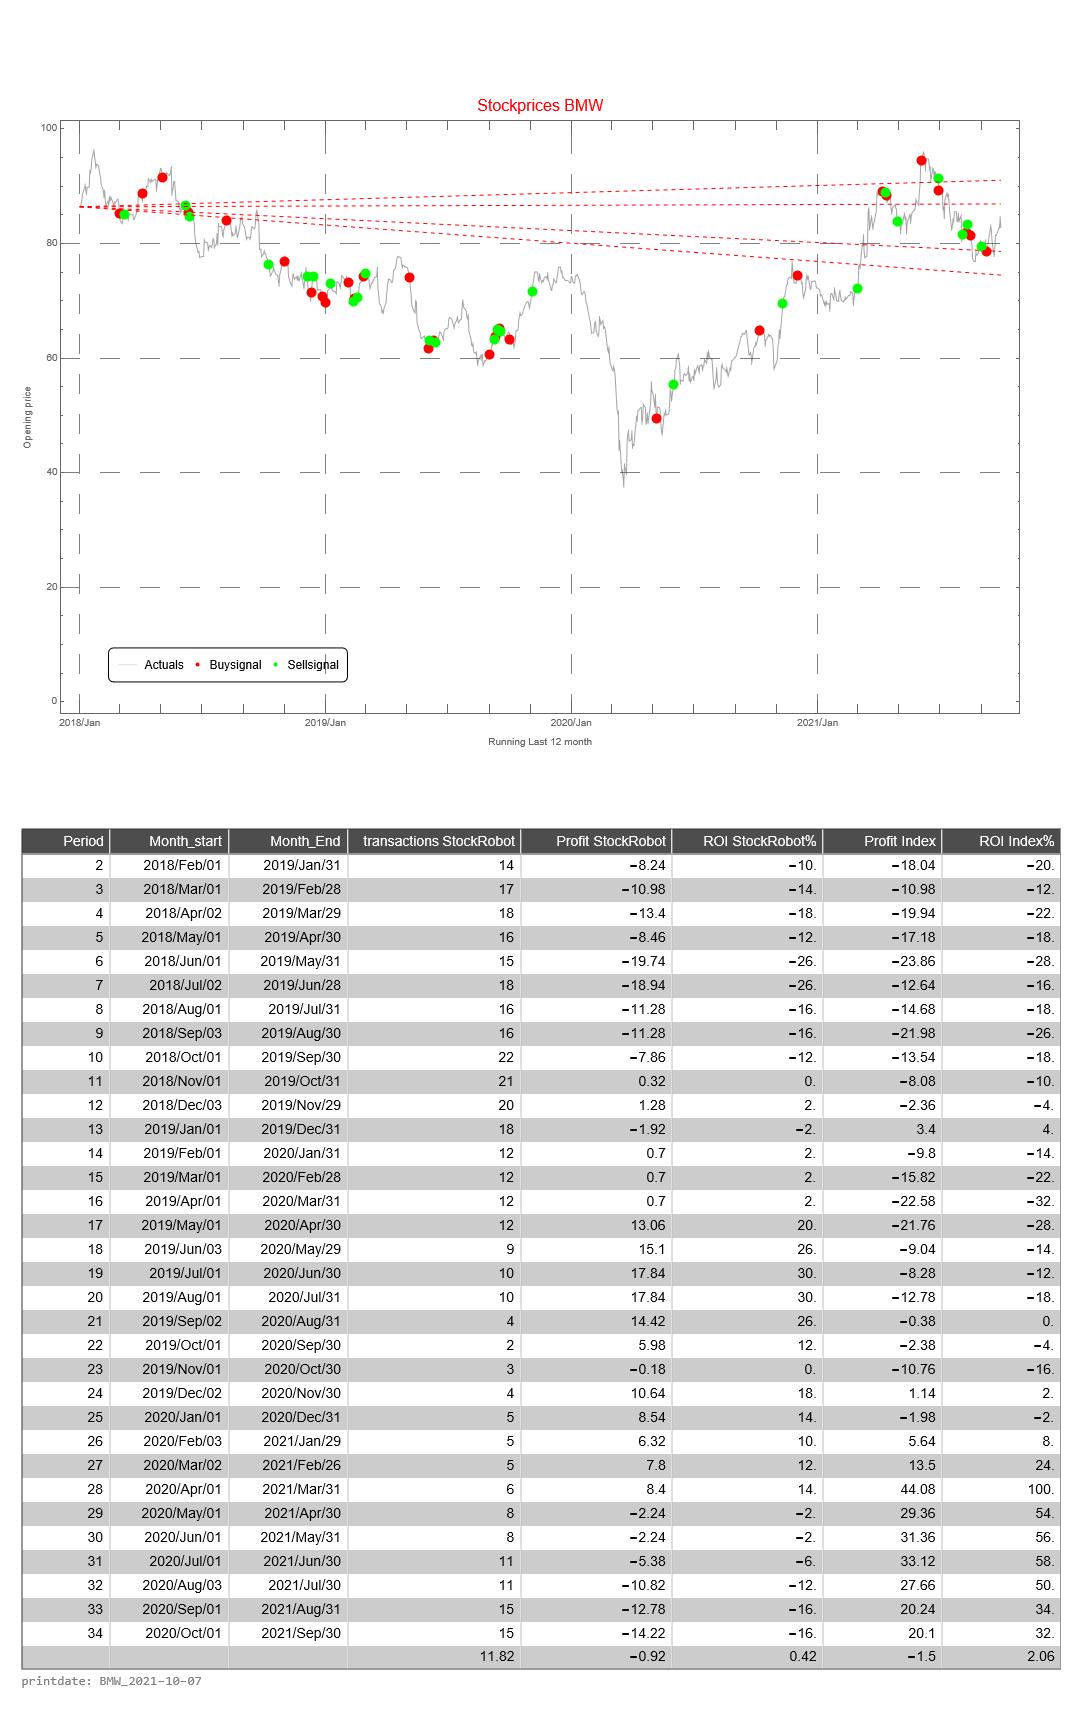
This simulation is repeated 31 times. The difference is that with each subsequent simulation the period shifts by one month. When shifting the 12 months, the simulation only looks at the buy and sell signals from that particular period.
The return of the Trading Robot is calculated as follows.
- the difference between the price of the fund between selling and buying (of 1 share of the relevant fund)
- we calculate the cumulative difference for multiple buy and sell signals
- if there has been no sell signal at the end of the 12-month period, we use the price on the last day of the 12-month period
- we calculate the average price value of a buy signal
- the cumulative difference divided by the average price is the return over the 12 months
The Profit HR (Trading Robot Profit) is the cumulative difference between buy and sell signals of 1 share of the relevant fund
The return of the Trading Robot is the Profit over the last 12 month divided by the price value of the first day of a 12-month period of the relevant fund